EDA on Sentiment Data#
%config InlineBackend.figure_format='retina'
from ekorpkit import eKonf

eKonf.setLogger("WARNING")
print("version:", eKonf.__version__)
print("is notebook?", eKonf.is_notebook())
print("is colab?", eKonf.is_colab())
print("evironment varialbles:")
eKonf.print(eKonf.env().dict())
INFO:ekorpkit.base:IPython version: (6, 9, 0), client: jupyter_client
INFO:ekorpkit.base:Google Colab not detected.
version: 0.1.35+0.g69734d6.dirty
is notebook? True
is colab? False
evironment varialbles:
{'CUDA_DEVICE_ORDER': None,
 'CUDA_VISIBLE_DEVICES': None,
 'EKORPKIT_CONFIG_DIR': '/workspace/projects/ekorpkit-book/config',
 'EKORPKIT_DATA_DIR': None,
 'EKORPKIT_LOG_LEVEL': 'WARNING',
 'EKORPKIT_PROJECT': 'ekorpkit-book',
 'EKORPKIT_WORKSPACE_ROOT': '/workspace',
 'KMP_DUPLICATE_LIB_OK': 'TRUE',
 'NUM_WORKERS': 230}
start_year = 1999
data_dir = "../data/fomc"
eKonf.env().FRED_API_KEY
pydantic.types.SecretStr
Load datasets#
tone_data_lm = eKonf.load_data("fomc_tone_data_lm.parquet", data_dir)
tone_data_lm
| polarity_mean_beigebook | polarity_mean_meeting_script | polarity_mean_minutes | polarity_mean_press_conf | polarity_mean_speech | polarity_mean_statement | polarity_mean_testimony | polarity_diffusion_beigebook | polarity_diffusion_meeting_script | polarity_diffusion_minutes | ... | num_tokens_sum_speech | num_tokens_sum_statement | num_tokens_sum_testimony | num_tokens_mean_beigebook | num_tokens_mean_meeting_script | num_tokens_mean_minutes | num_tokens_mean_press_conf | num_tokens_mean_speech | num_tokens_mean_statement | num_tokens_mean_testimony | |
|---|---|---|---|---|---|---|---|---|---|---|---|---|---|---|---|---|---|---|---|---|---|
| date | |||||||||||||||||||||
| 1990-02-07 | NaN | -0.087583 | NaN | NaN | NaN | NaN | NaN | NaN | -0.095663 | NaN | ... | NaN | NaN | NaN | NaN | 30.213010 | NaN | NaN | NaN | NaN | NaN |
| 1990-03-27 | NaN | -0.171992 | NaN | NaN | NaN | NaN | NaN | NaN | -0.179702 | NaN | ... | NaN | NaN | NaN | NaN | 29.846369 | NaN | NaN | NaN | NaN | NaN |
| 1990-05-15 | NaN | -0.116052 | NaN | NaN | NaN | NaN | NaN | NaN | -0.125461 | NaN | ... | NaN | NaN | NaN | NaN | 29.749077 | NaN | NaN | NaN | NaN | NaN |
| 1990-07-03 | NaN | -0.114829 | NaN | NaN | NaN | NaN | NaN | NaN | -0.117794 | NaN | ... | NaN | NaN | NaN | NaN | 29.667920 | NaN | NaN | NaN | NaN | NaN |
| 1990-08-21 | NaN | -0.209552 | NaN | NaN | NaN | NaN | NaN | NaN | -0.219403 | NaN | ... | NaN | NaN | NaN | NaN | 31.032836 | NaN | NaN | NaN | NaN | NaN |
| ... | ... | ... | ... | ... | ... | ... | ... | ... | ... | ... | ... | ... | ... | ... | ... | ... | ... | ... | ... | ... | ... |
| 2021-11-30 | NaN | NaN | NaN | NaN | -0.167014 | NaN | -0.12 | NaN | NaN | NaN | ... | 3066.0 | NaN | 556.0 | NaN | NaN | NaN | NaN | 31.937500 | NaN | 27.8 |
| 2021-12-01 | -0.046022 | NaN | NaN | NaN | NaN | NaN | NaN | -0.048109 | NaN | NaN | ... | NaN | NaN | NaN | 22.539497 | NaN | NaN | NaN | NaN | NaN | NaN |
| 2021-12-02 | NaN | NaN | NaN | NaN | -0.077381 | NaN | NaN | NaN | NaN | NaN | ... | 6514.0 | NaN | NaN | NaN | NaN | NaN | NaN | 36.188889 | NaN | NaN |
| 2021-12-15 | NaN | NaN | -0.043929 | -0.075441 | NaN | 0.166667 | NaN | NaN | NaN | -0.064286 | ... | NaN | 489.0 | NaN | NaN | NaN | 30.521429 | 37.587413 | NaN | 27.166667 | NaN |
| 2021-12-17 | NaN | NaN | NaN | NaN | -0.356613 | NaN | NaN | NaN | NaN | NaN | ... | 3694.0 | NaN | NaN | NaN | NaN | NaN | NaN | 29.317460 | NaN | NaN |
1876 rows × 35 columns
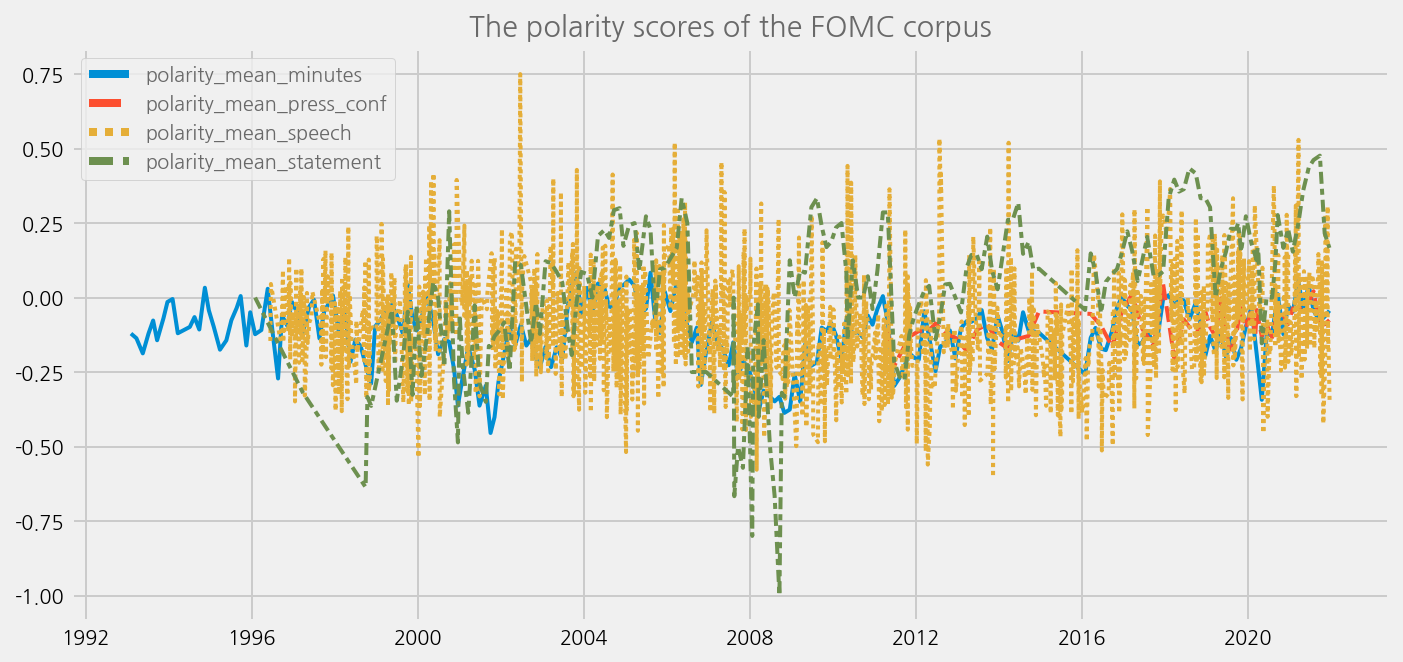
Plot the sentiment scores#
cfg = eKonf.compose("visualize/plot=lineplot")
cfg.plot.y = [
    "polarity_mean_minutes",
    "polarity_mean_press_conf",
    "polarity_mean_speech",
    "polarity_mean_statement",
]
cfg.ax.title = "The polarity scores of the FOMC corpus"
eKonf.instantiate(cfg, data=tone_data_lm)
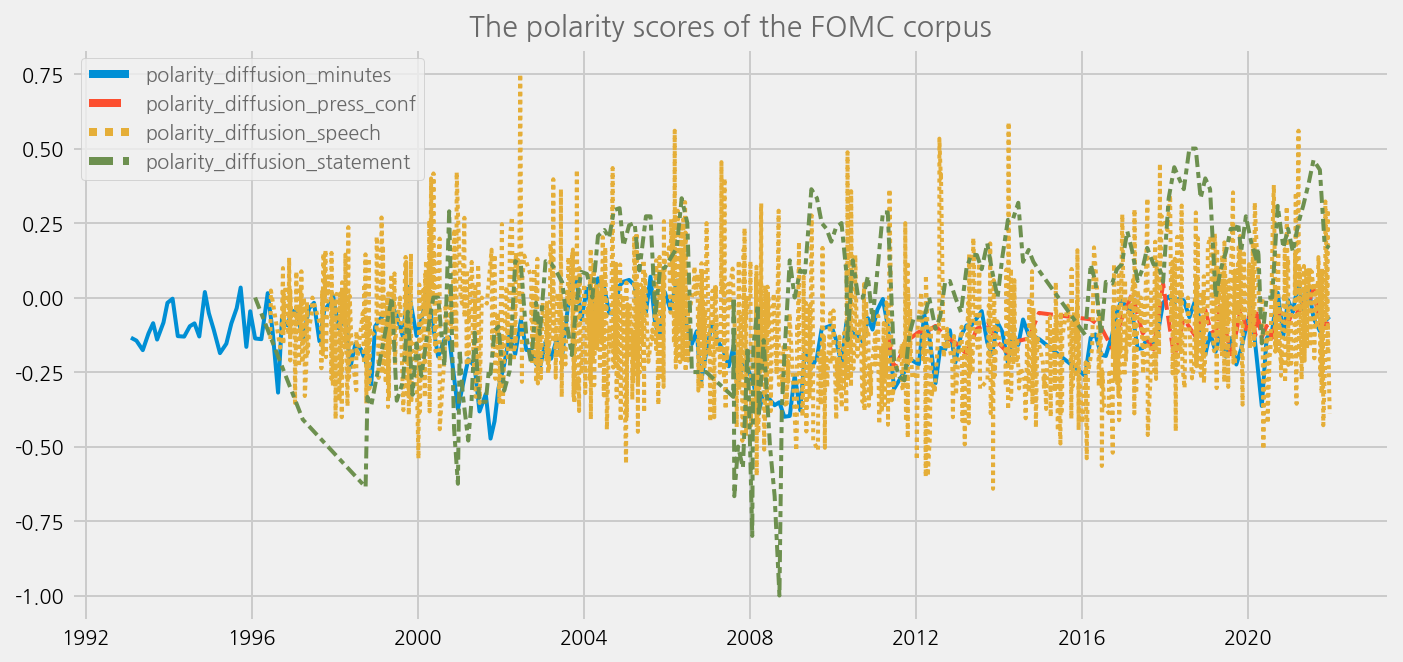
cfg = eKonf.compose("visualize/plot=lineplot")
cfg.plot.y = [
    "polarity_diffusion_minutes",
    "polarity_diffusion_press_conf",
    "polarity_diffusion_speech",
    "polarity_diffusion_statement",
]
cfg.ax.title = "The polarity scores of the FOMC corpus"
eKonf.instantiate(cfg, data=tone_data_lm)
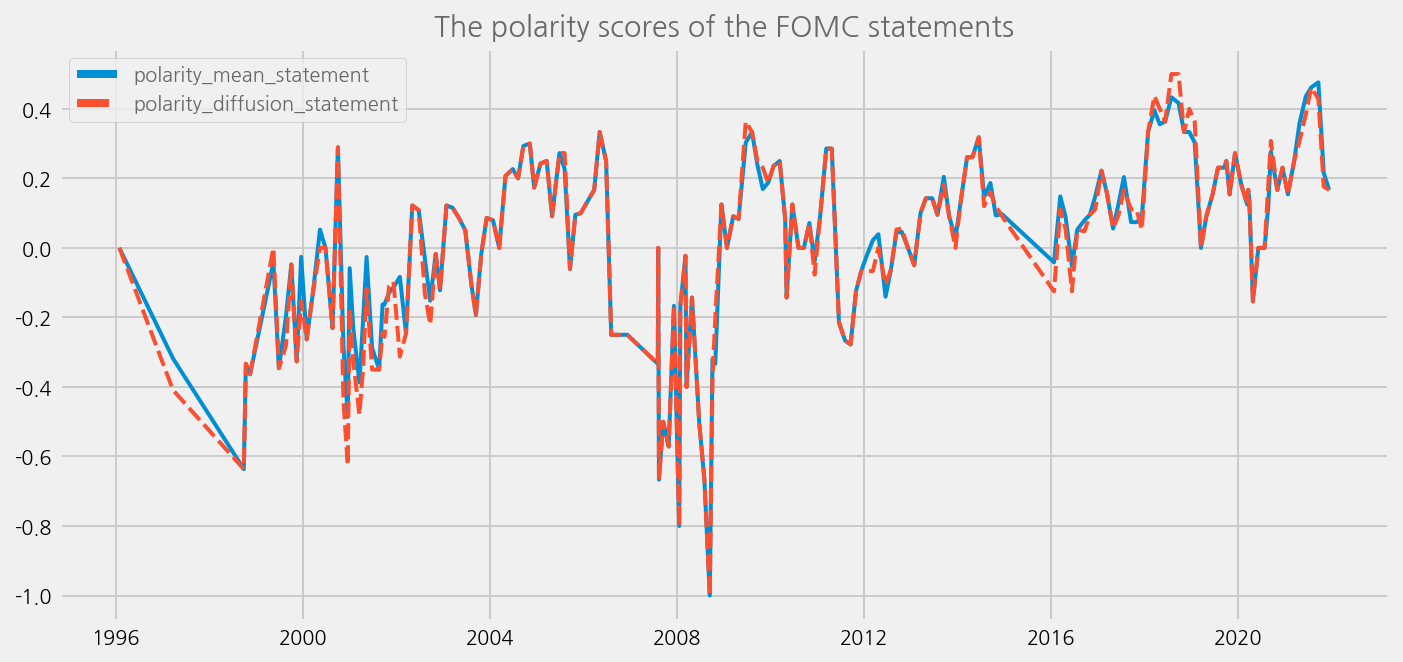
cfg = eKonf.compose("visualize/plot=lineplot")
cfg.plot.y = ["polarity_mean_statement", "polarity_diffusion_statement"]
cfg.ax.title = "The polarity scores of the FOMC statements"
eKonf.instantiate(cfg, data=tone_data_lm)
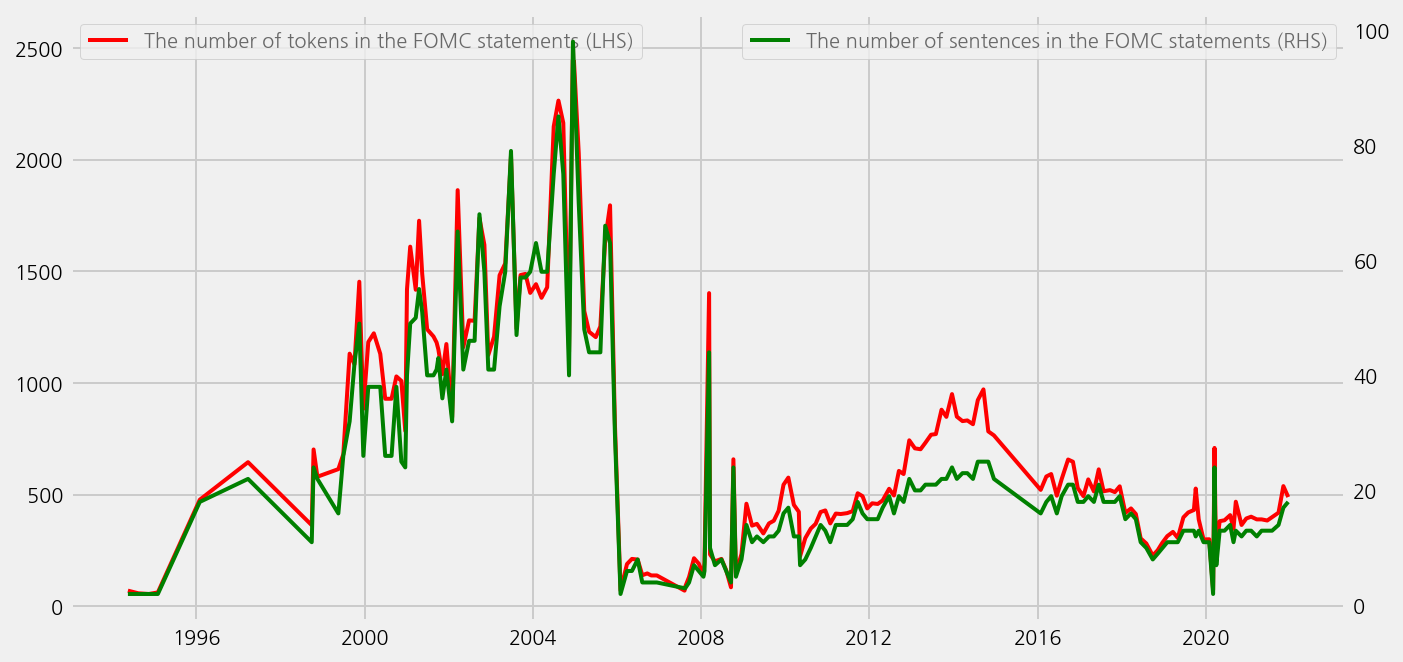
cfg = eKonf.compose("visualize/plot=lineplot")
cfg.plots.append(cfg.plot.copy())
cfg.plots[0].y = "num_tokens_sum_statement"
cfg.plots[0].rcParams = dict(linewidth=2.5, color="red")
cfg.plots[1].y = "num_examples_statement"
cfg.plots[1].rcParams = dict(linewidth=1.5, color="green")
cfg.plots[1].secondary_y = True
cfg.ax.legend = dict(
    labels=[
        "The number of tokens in the FOMC statements (LHS)",
    ],
    loc=2,
)
ax2 = cfg.ax.copy()
ax2.grid = False
ax2.secondary_y = True
ax2.legend = dict(
    labels=["The number of sentences in the FOMC statements (RHS)"],
    loc=1,
)
cfg.axes.append(ax2)

eKonf.instantiate(cfg, data=tone_data_lm)
sentiments = [
    "polarity_diffusion_statement",
    "finbert_diffusion_statement",
    "t5_diffusion_statement",
]

cfg = eKonf.compose("visualize/plot=lineplot")
cfg.plot.y = sentiments
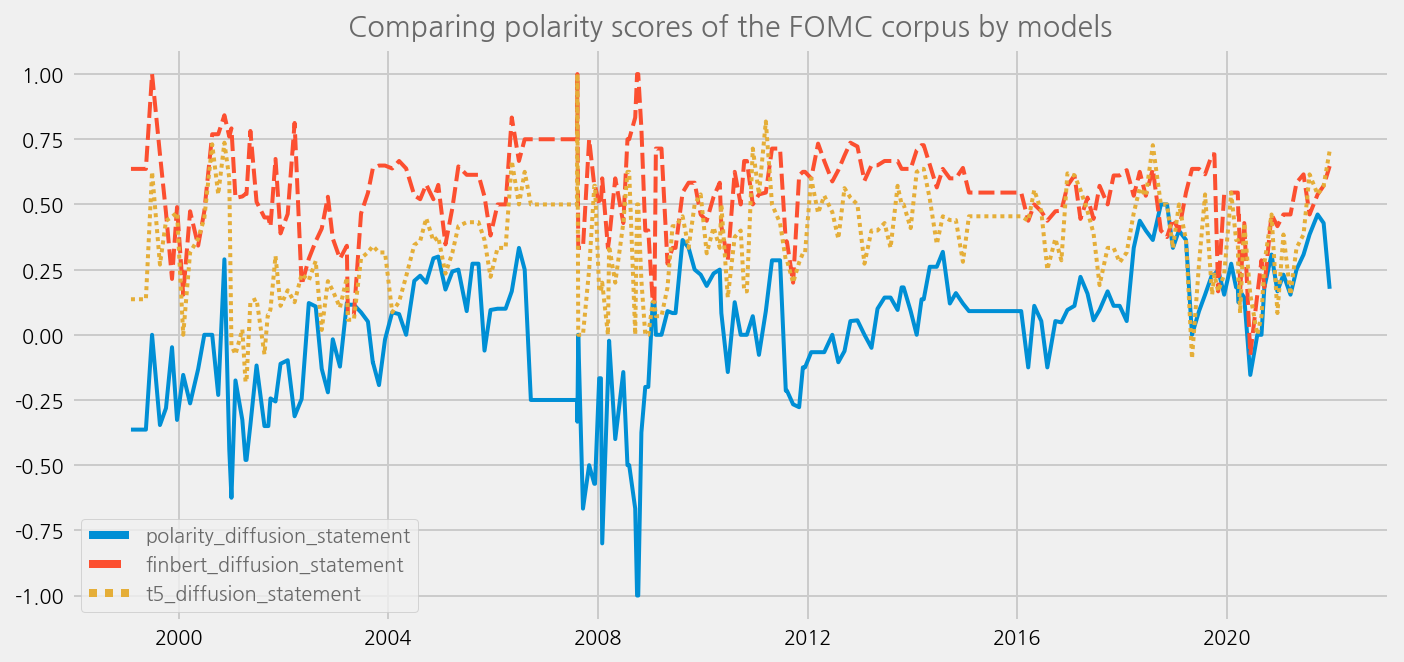
cfg.ax.title = "Comparing polarity scores of the FOMC corpus by models"
eKonf.instantiate(cfg, data=merged_tone_data)
sentiments = [
    "polarity_diffusion_minutes",
    "finbert_diffusion_minutes",
    "t5_diffusion_minutes",
]

cfg = eKonf.compose("visualize/plot=lineplot")
cfg.plot.y = sentiments
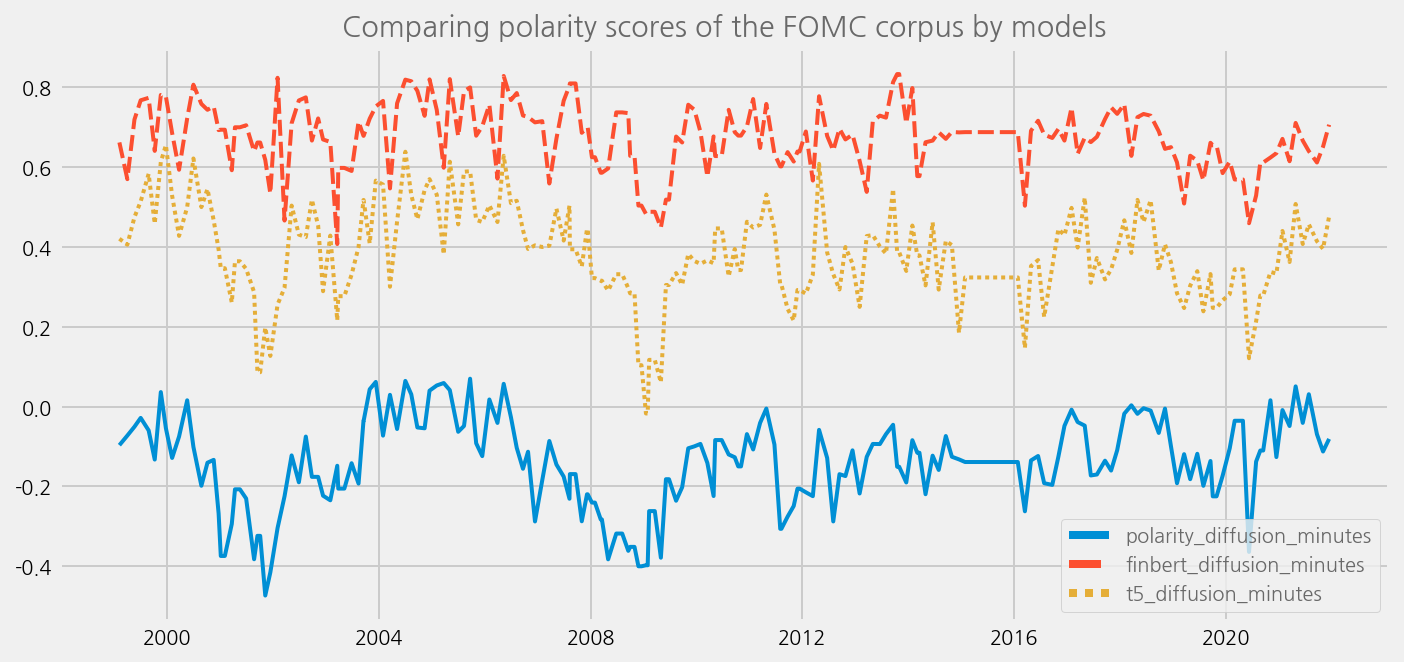
cfg.ax.title = "Comparing polarity scores of the FOMC corpus by models"
eKonf.instantiate(cfg, data=merged_tone_data)
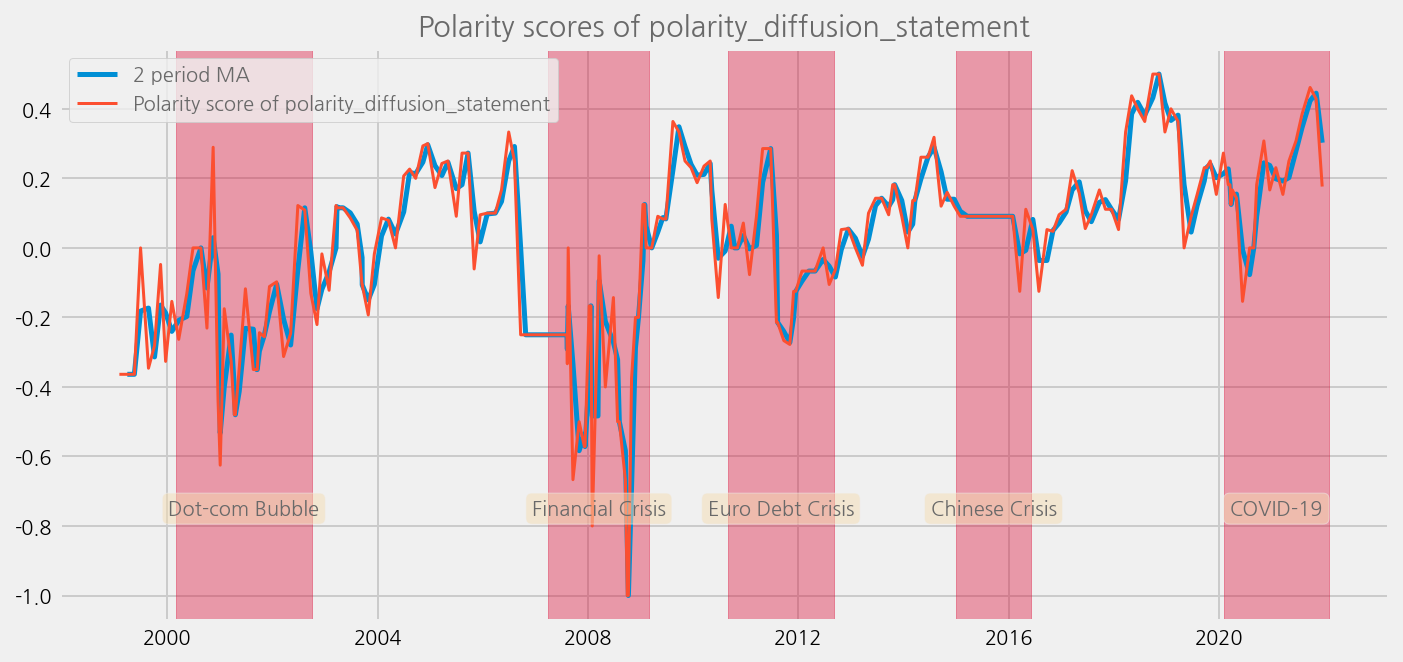
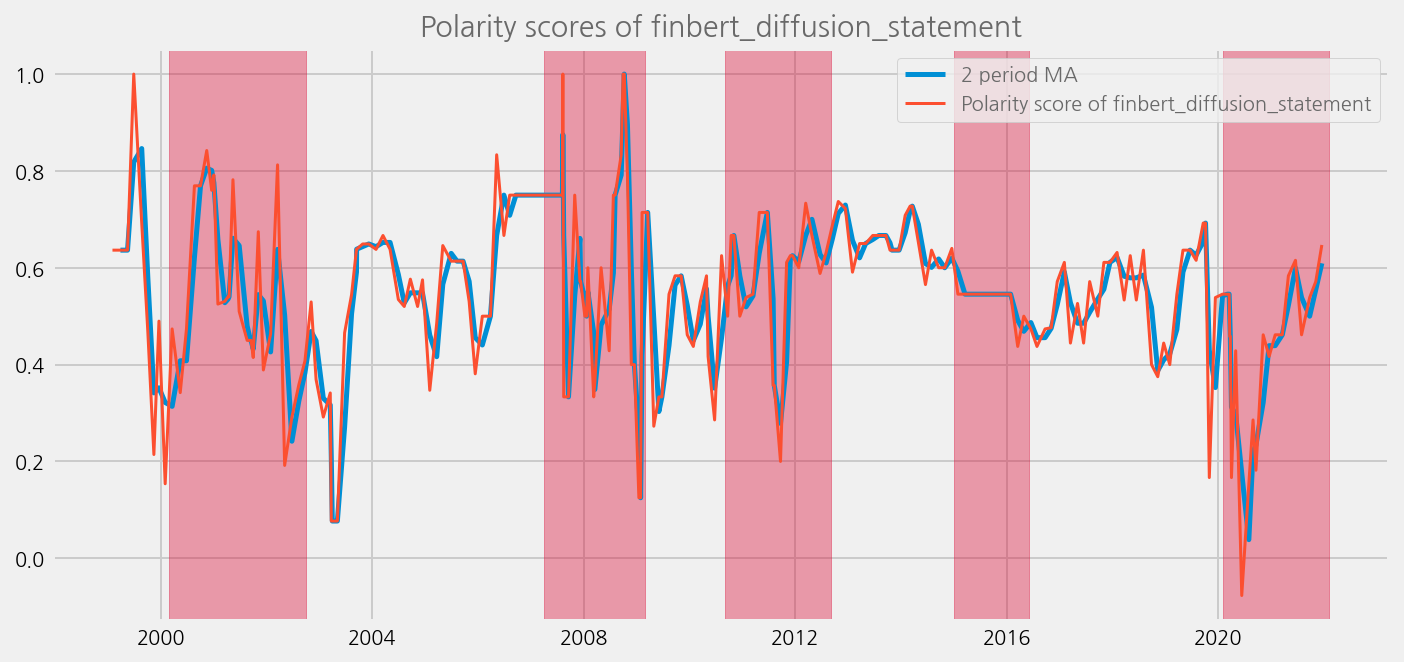
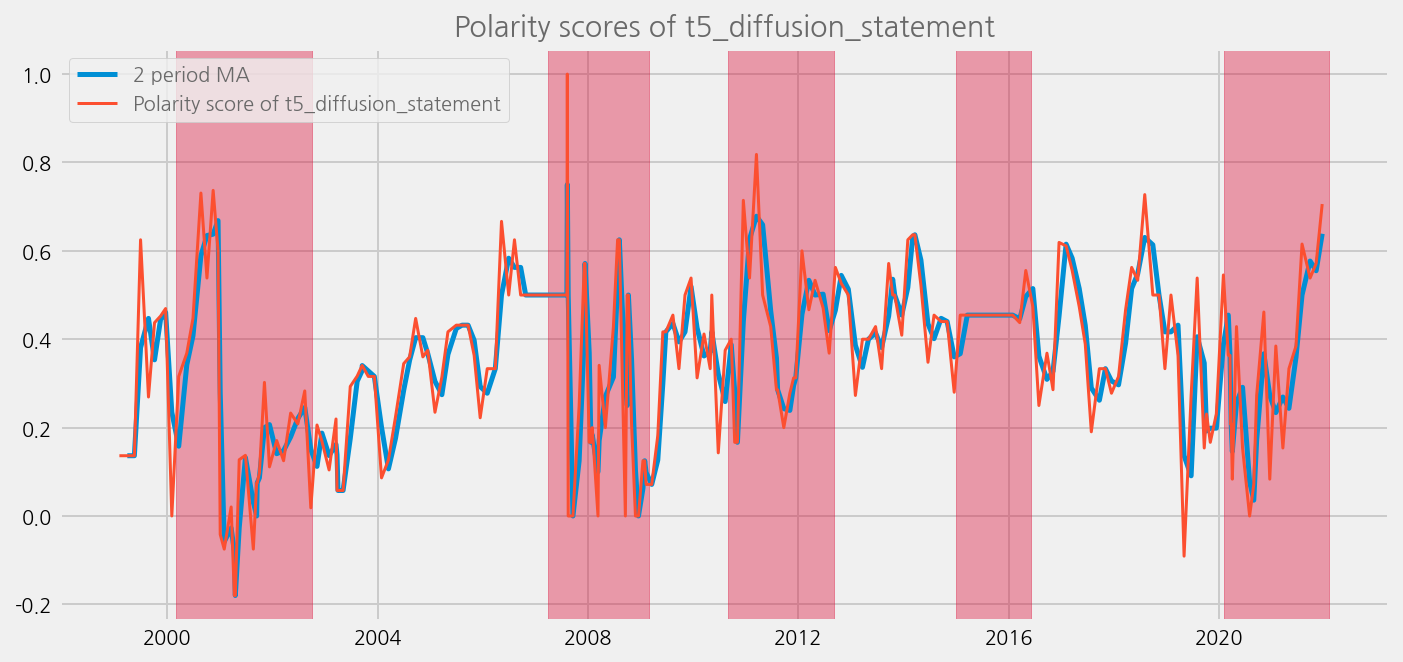
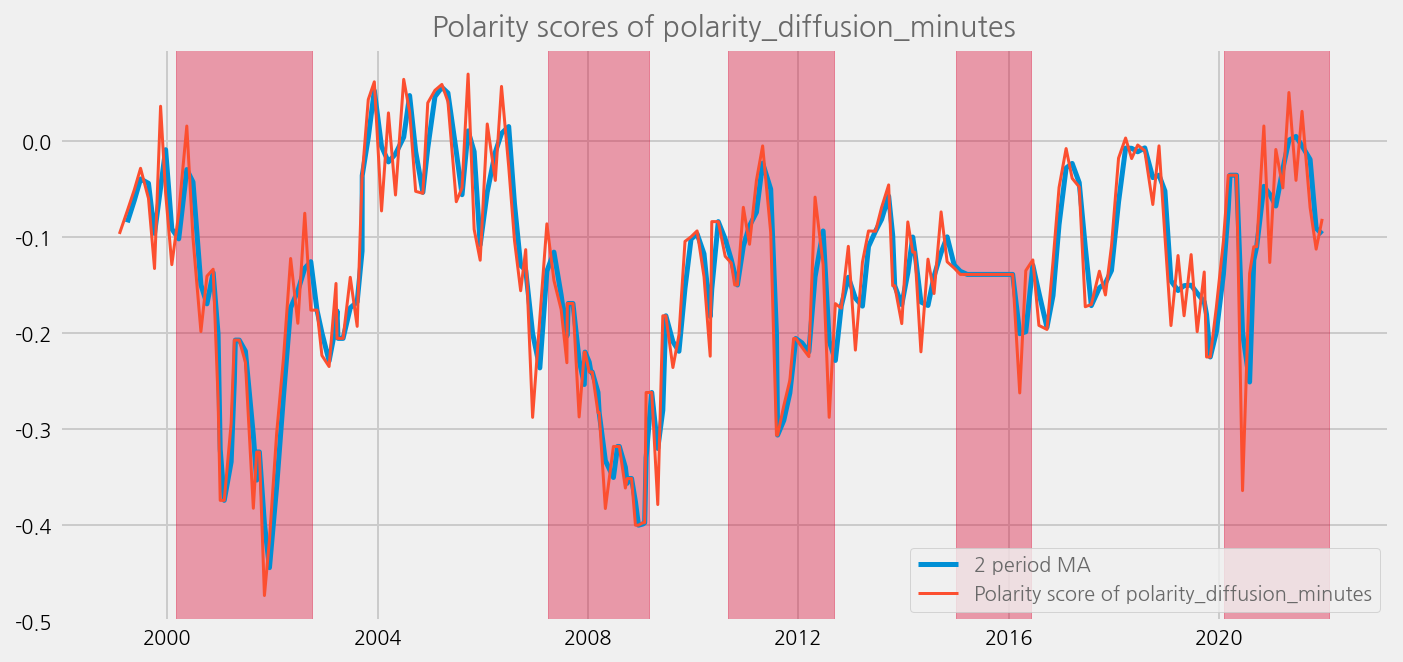
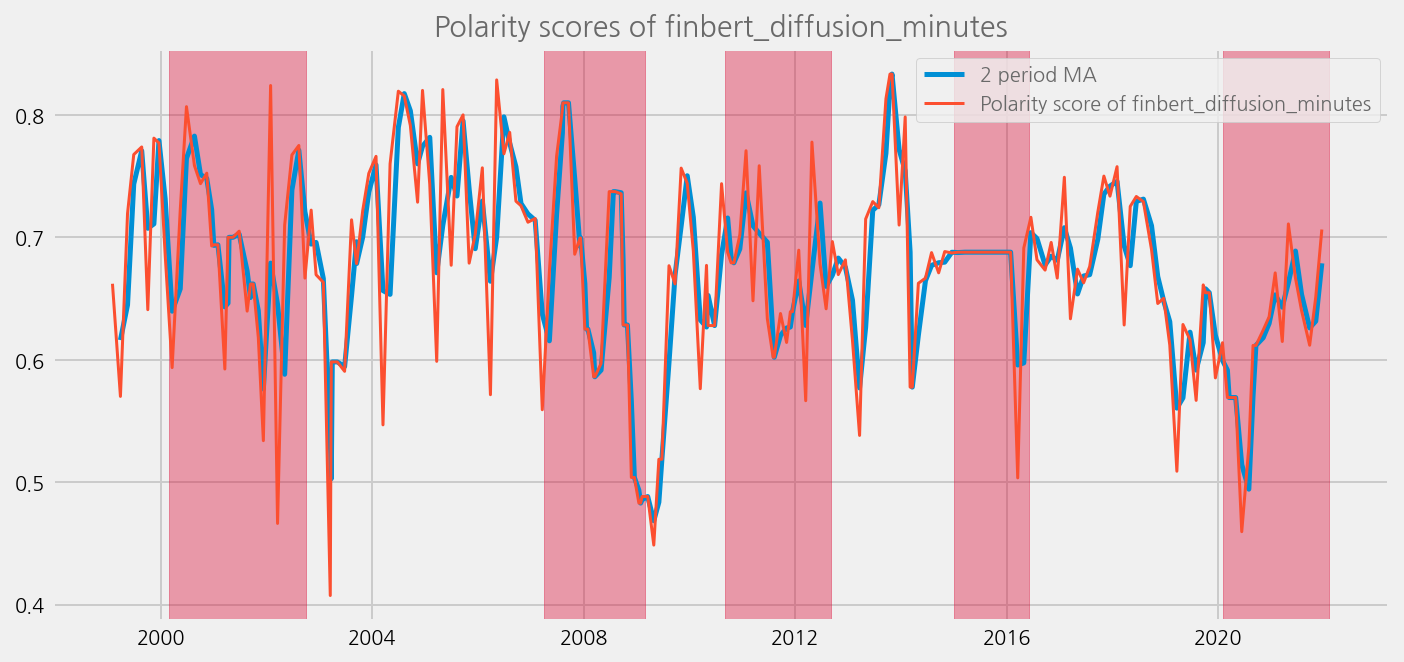
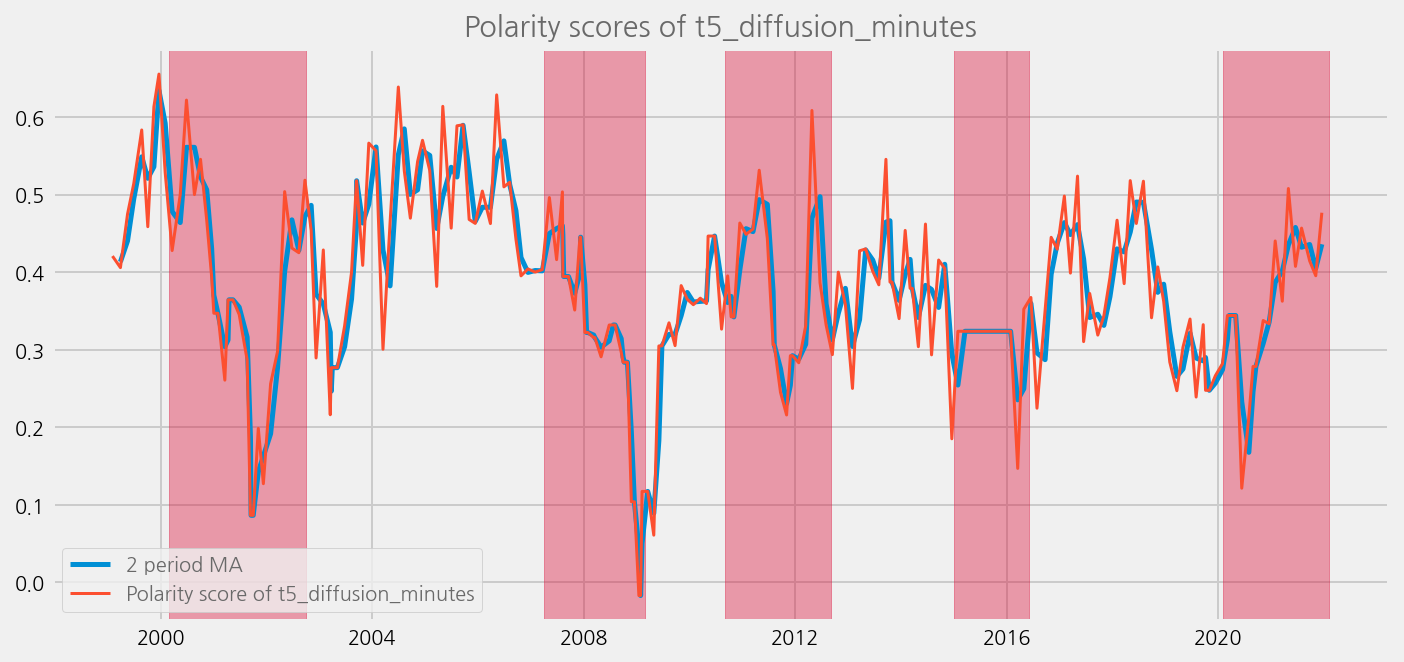
Plot the results and compare to the economical uncertainty / systemic risk periods#
def plot_sentiments_over_crisis_periods(name="polarity_diffusion_statement", window=2):
    recessions = fomc.recessions.to_dict(orient="records")

    span_args = eKonf.compose("visualize/plot/ax/axvspan")
    annot_args = eKonf.compose("visualize/plot/ax/annotation")
    span_args.color = "crimson"
    span_args.alpha = 0.4

    spans = []
    annotations = []
    for span in recessions:
        annotation = span["name"]
        start = span["from_date"]
        end = span["to_date"]
        span = span_args.copy()
        span.xmin, span.xmax = eKonf.to_dateparm(start), eKonf.to_dateparm(end)

        x = start + (end - start) / 2
        y = -0.75
        annot = annot_args.copy()
        annot.text, annot.x, annot.y = annotation, eKonf.to_dateparm(x), y
        spans.append(span)
        annotations.append(annot)

    merged_tone_data["polarity_ma"] = merged_tone_data[name].rolling(window).mean()

    cfg = eKonf.compose("visualize/plot=lineplot")
    cfg.plots.append(cfg.plot.copy())
    cfg.plots[0].y = "polarity_ma"
    cfg.plots[0].linewidth = 2.5
    cfg.plots[0].palette = "r"
    cfg.plots[1].y = name
    cfg.plots[1].linewidth = 1.5
    cfg.plots[1].palette = "g"
    cfg.ax.title = f"Polarity scores of {name}"
    cfg.ax.legend.labels = [
        f"{window} period MA",
        f"Polarity score of {name}",
    ]
    cfg.ax.axvspans = spans
    cfg.ax.annotations = annotations
    eKonf.instantiate(cfg, data=merged_tone_data)
sentiments = [
    "polarity_diffusion_statement",
    "finbert_diffusion_statement",
    "t5_diffusion_statement",
]
for name in sentiments:
    plot_sentiments_over_crisis_periods(name)
sentiments = [
    "polarity_diffusion_minutes",
    "finbert_diffusion_minutes",
    "t5_diffusion_minutes",
]
for name in sentiments:
    plot_sentiments_over_crisis_periods(name)
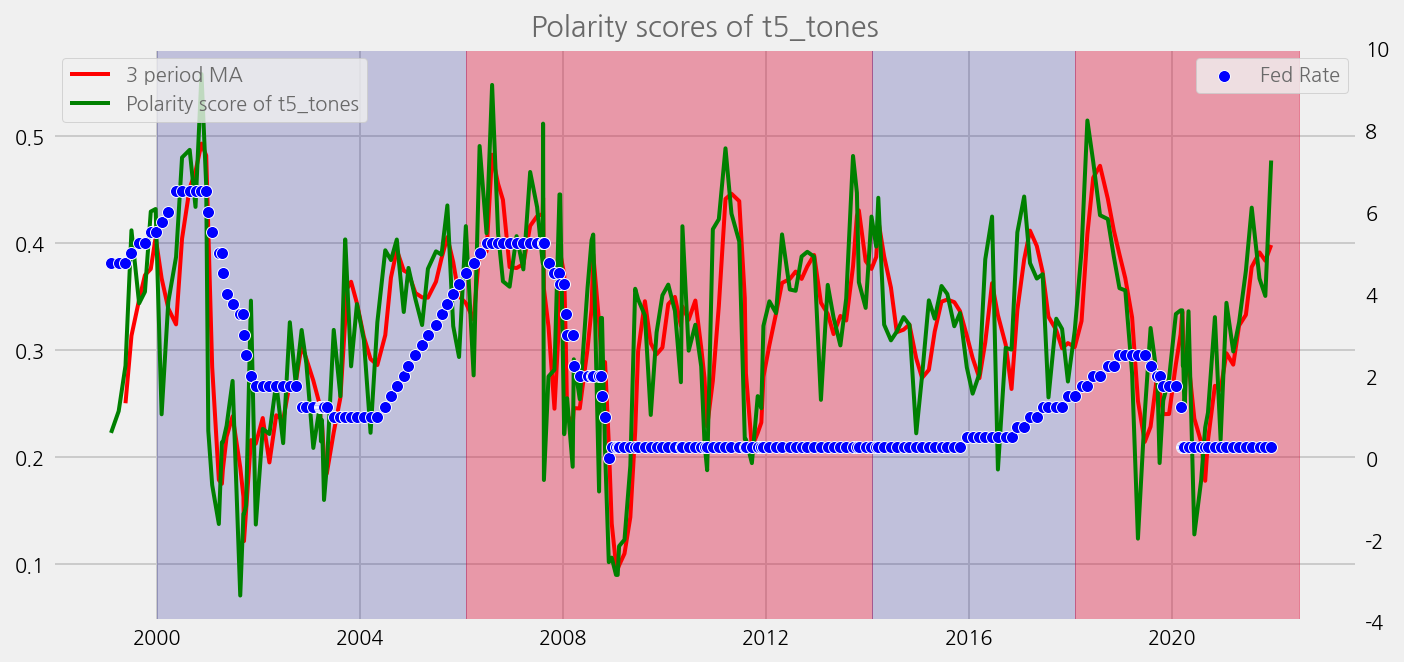
from datetime import datetime

chair = fomc.chairpersons
chair = chair[chair.to_date.dt.year >= start_year]


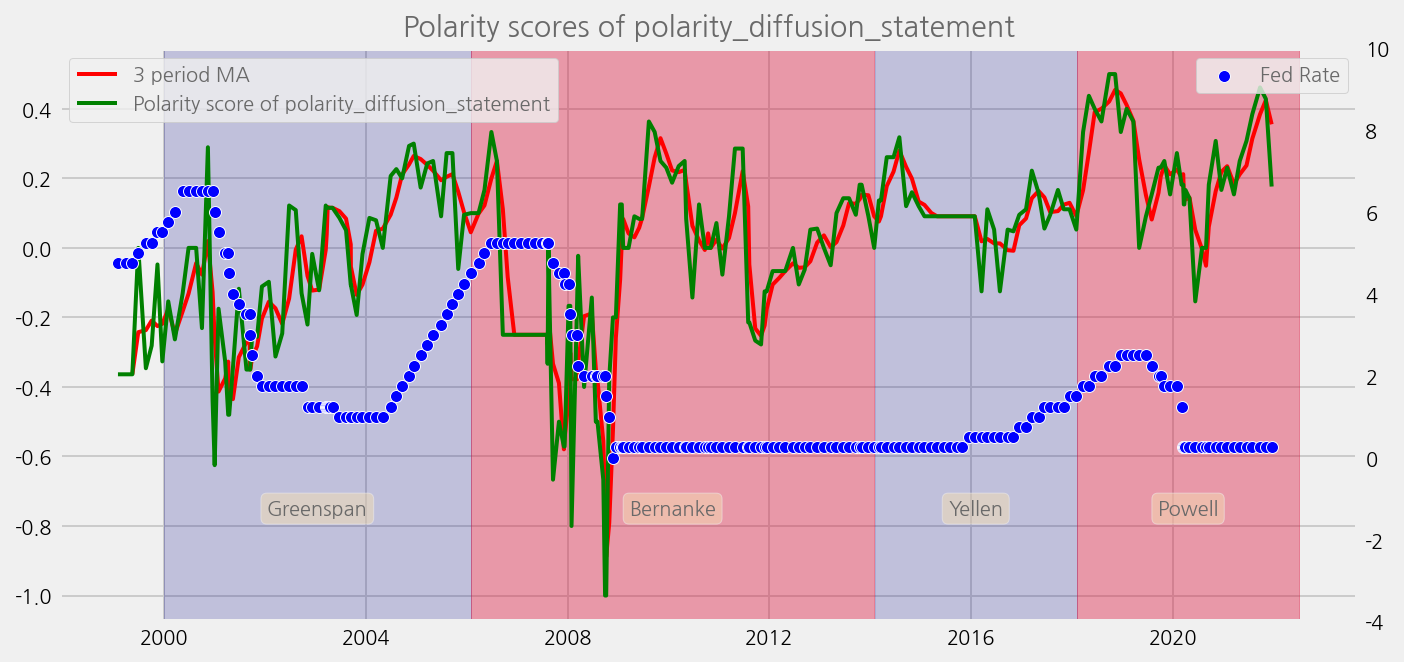
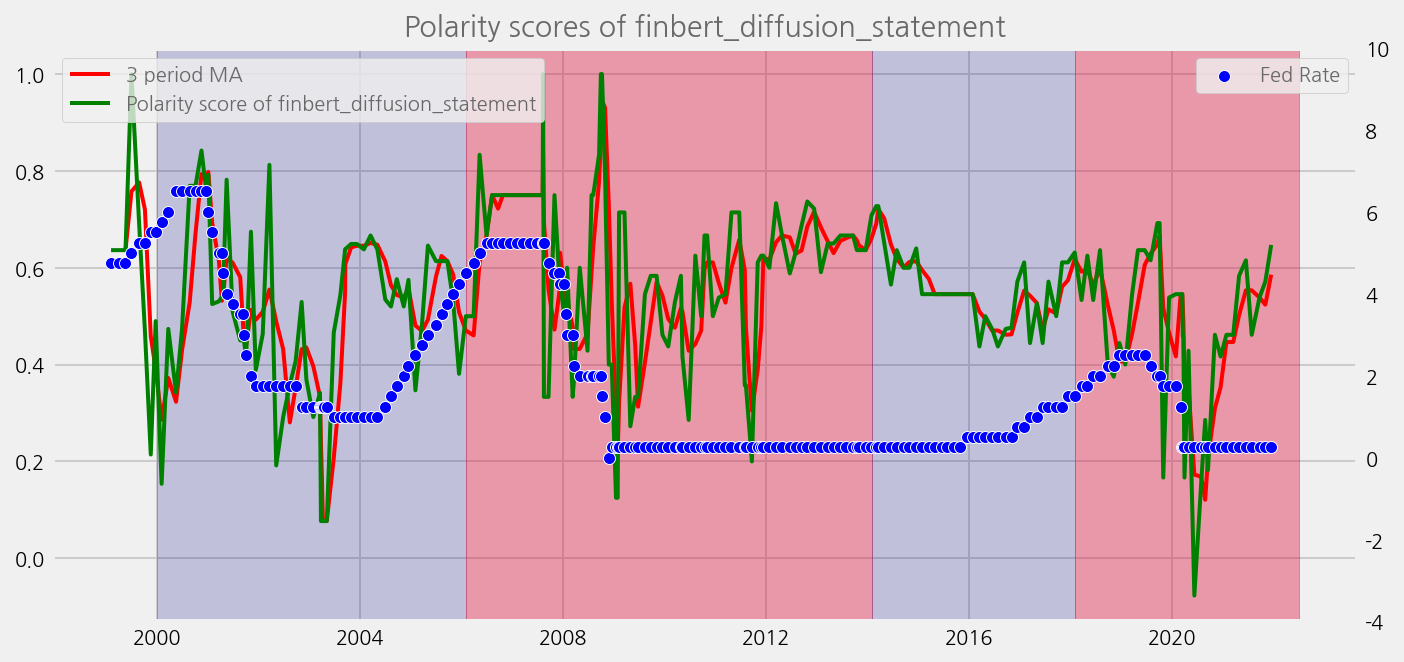
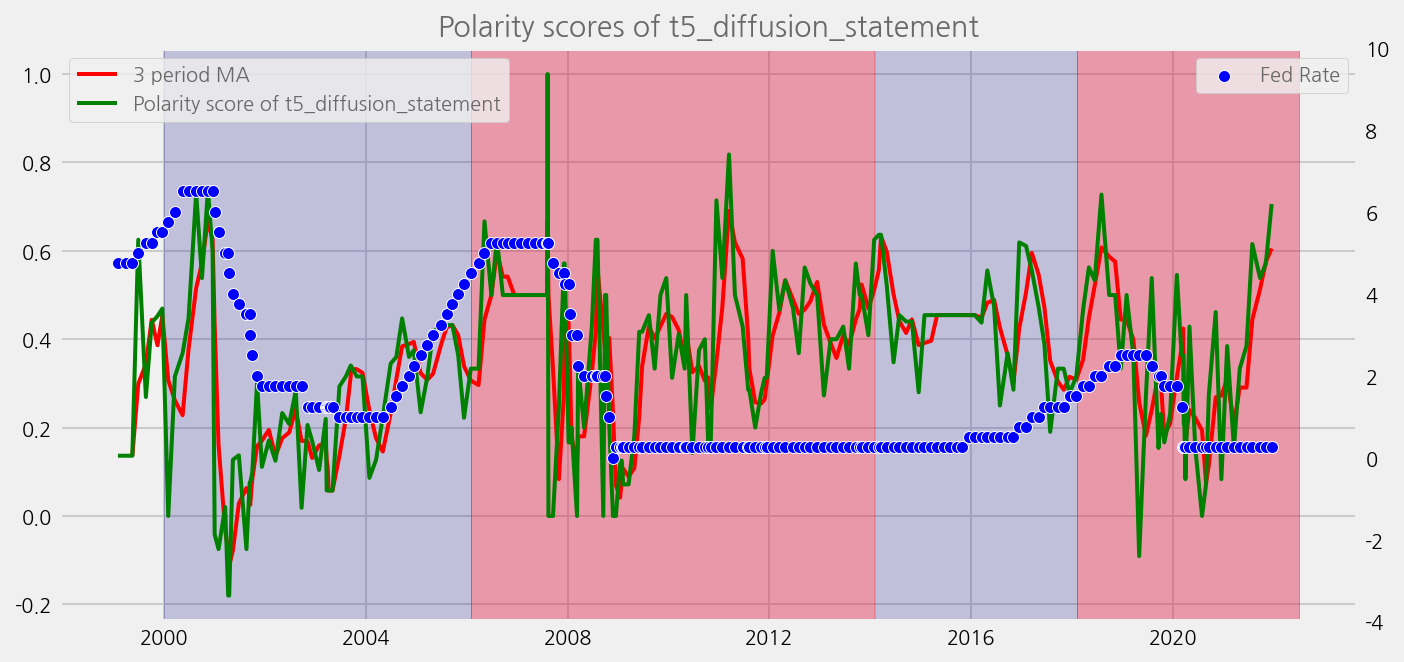
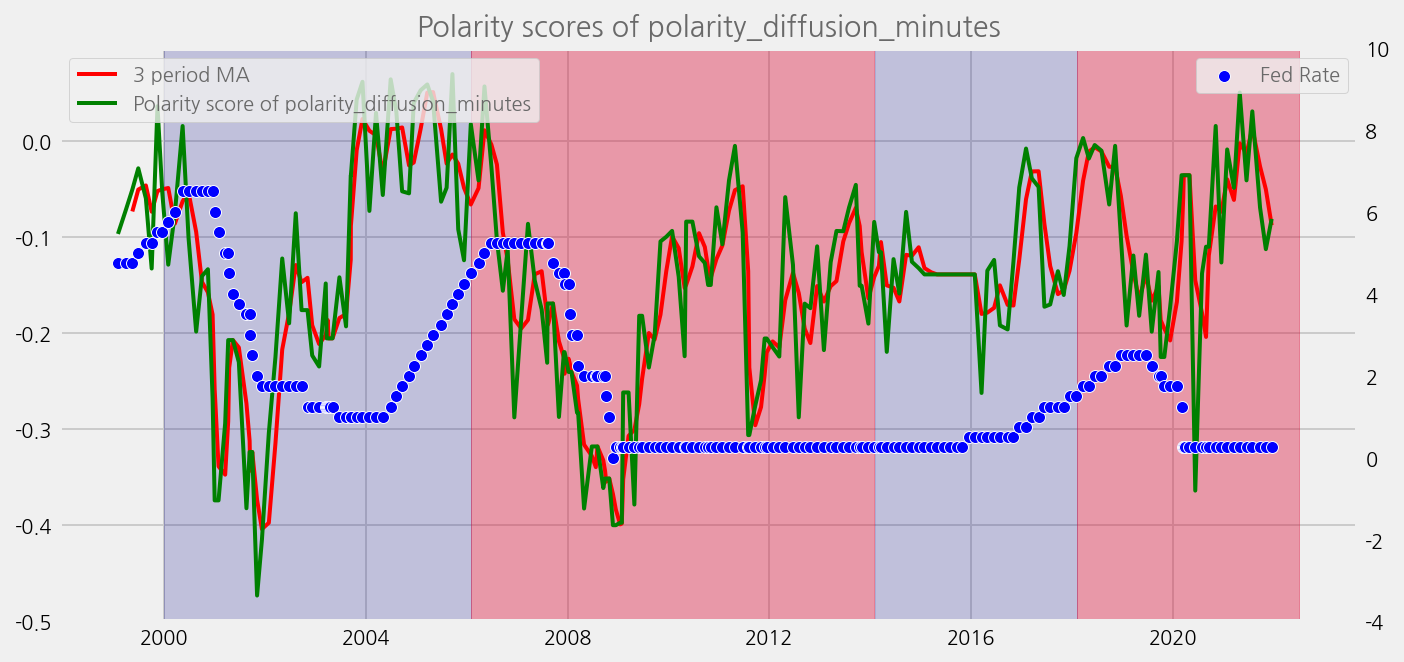
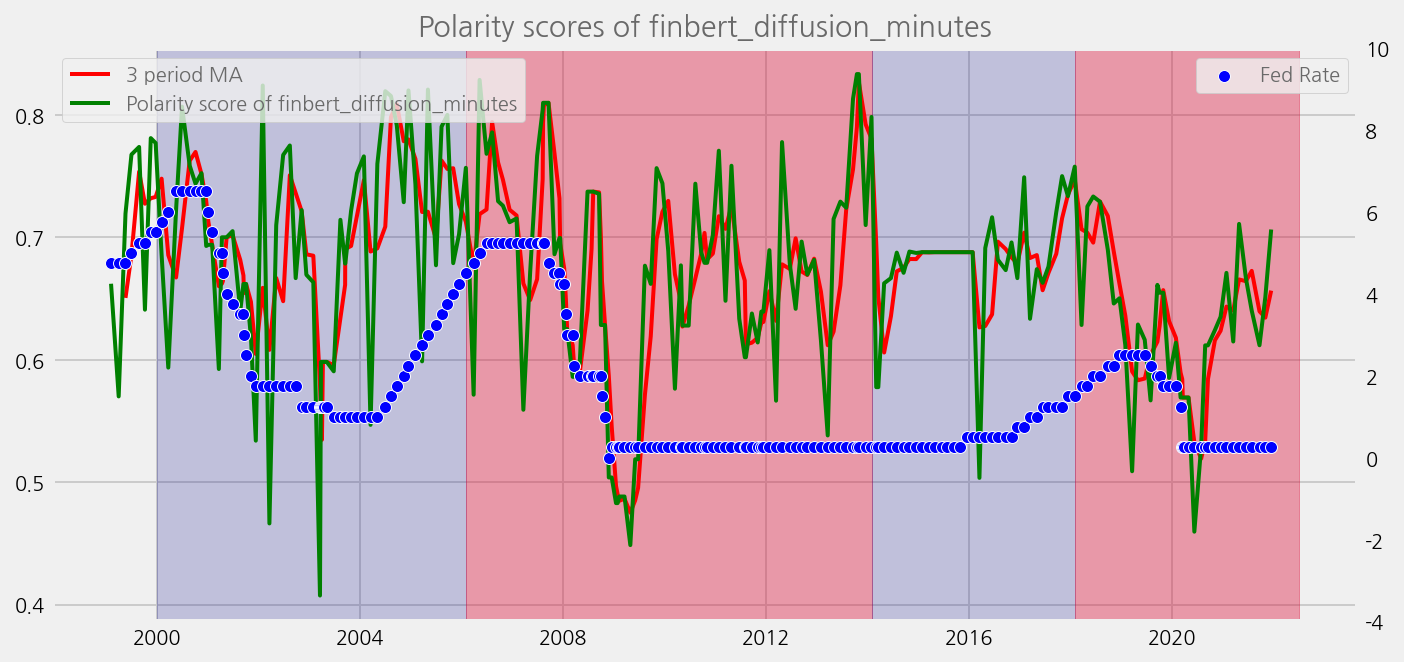
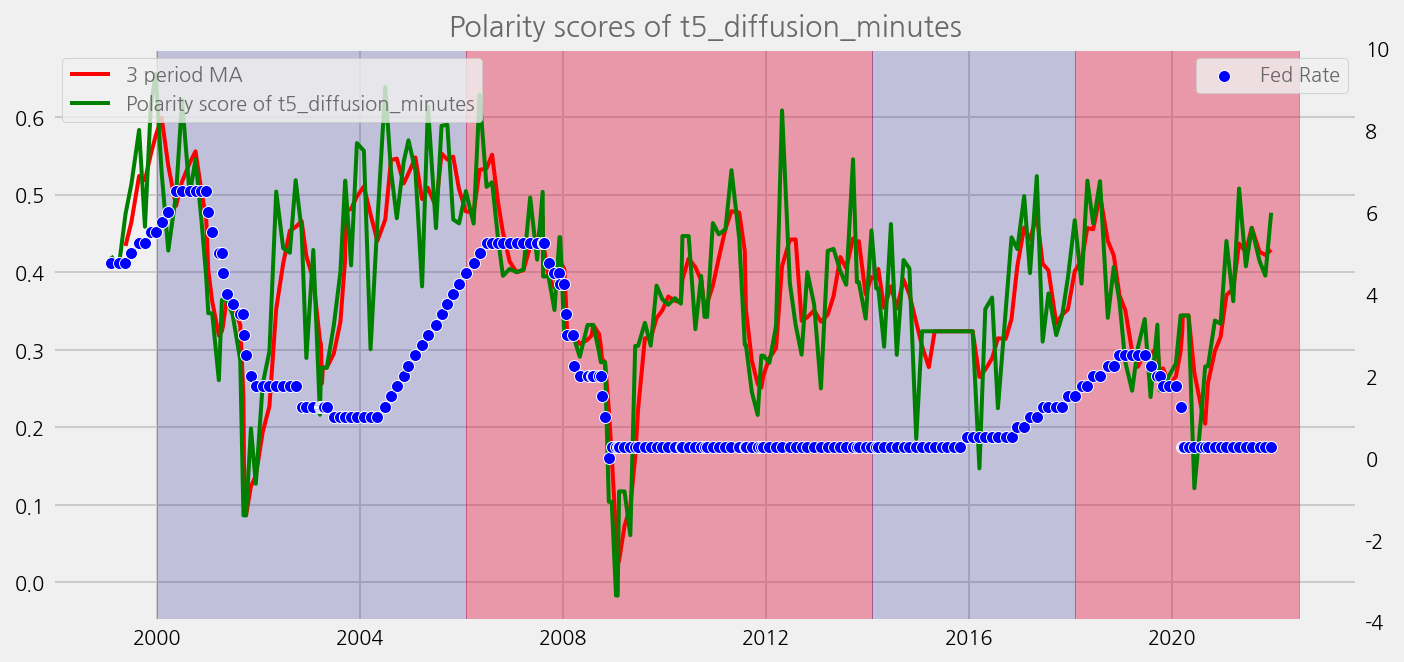
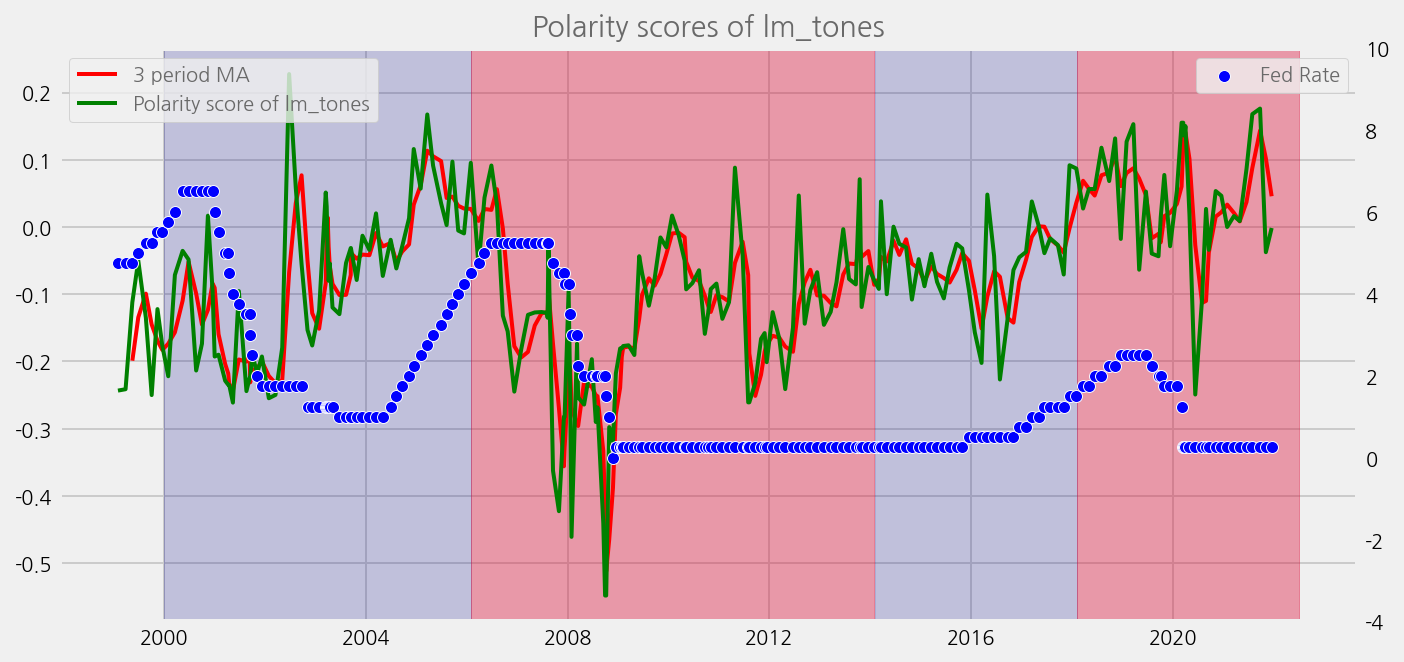
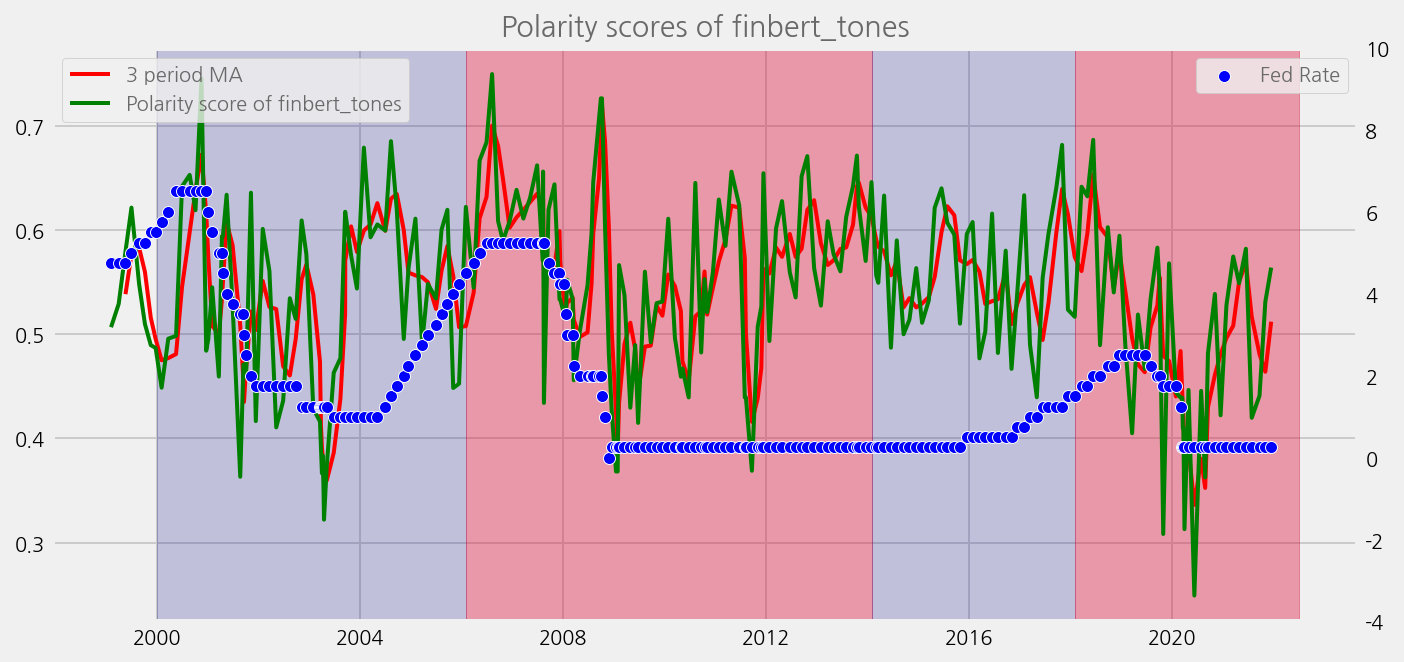
def plot_sentiments_over_chair_periods(name="polarity_diffusion_statement", window=3):
    annot_args = eKonf.compose("visualize/plot/ax/annotation")

    spans = []
    annotations = []
    for row in chair.iterrows():
        row_num = row[0]
        start = row[1]["from_date"]
        if start.year < start_year:
            start = datetime(2000, 1, 1)
        end = row[1]["to_date"]
        annotation = row[1]["last_name"]
        color = "crimson" if row_num % 2 == 0 else "darkblue"
        alpha = 0.4 if row_num % 2 == 0 else 0.2
        span = {
            "xmin": eKonf.to_dateparm(start),
            "xmax": eKonf.to_dateparm(end),
            "alpha": alpha,
            "color": color,
        }

        x = start + (end - start) / 2
        y = -0.75
        annot = annot_args.copy()
        annot.text, annot.x, annot.y = annotation, eKonf.to_dateparm(x), y

        spans.append(span)
        annotations.append(annot)

    merged_tone_data["polarity_ma"] = merged_tone_data[name].rolling(window).mean()

    cfg = eKonf.compose("visualize/plot=lineplot")
    ax2 = cfg.ax.copy()

    cfg.plots.append(cfg.plot.copy())
    cfg.plots[0].y = "polarity_ma"
    cfg.plots[0].rcParams = dict(linewidth=2.5, color="red")
    cfg.plots[1].y = name
    cfg.plots[1].rcParams = dict(linewidth=1.5, color="green")
    cfg.ax.title = f"Polarity scores of {name}"
    cfg.ax.legend = dict(
        labels=[
            f"{window} period MA",
            f"Polarity score of {name}",
        ],
        loc=2,
    )
    scatter_cfg = eKonf.compose("visualize/plot/scatterplot")
    scatter_cfg.y = "rate"
    scatter_cfg.secondary_y = True
    scatter_cfg.rcParams = dict(color="blue", alpha=0.8)
    cfg.plots.append(scatter_cfg)

    ax2.grid = False
    ax2.secondary_y = True
    ax2.ylim = "(-4, 10)"
    ax2.legend = dict(
        labels=["Fed Rate"],
        loc=1,
    )
    cfg.axes.append(ax2)
    cfg.ax.axvspans = spans
    cfg.ax.annotations = annotations

    eKonf.instantiate(cfg, data=merged_tone_data)
sentiments = [
    "polarity_diffusion_statement",
    "finbert_diffusion_statement",
    "t5_diffusion_statement",
]
for name in sentiments:
    plot_sentiments_over_chair_periods(name)
sentiments = [
    "polarity_diffusion_minutes",
    "finbert_diffusion_minutes",
    "t5_diffusion_minutes",
]
for name in sentiments:
    plot_sentiments_over_chair_periods(name)

