Research Part II#
The Diffusion of Disruptive Technologies#
Bloom et al. [2021]
The paper identifies 29 disruptive technologies and documents their diffusion across firms and labor markets in the U.S. using textual analysis of patents, job postings, and earnings calls.
The locations where disruptive technologies are developed are geographically highly concentrated, even more so than overall patenting.
As the technologies mature and the number of new jobs related to them grows, they gradually spread geographically. While initial hiring is concentrated in high-skilled jobs, over time the mean skill level in new positions associated with the technologies declines, broadening the types of jobs that adopt a given technology.
The geographic diffusion of low-skilled positions is significantly faster than higher-skilled ones, so that the locations where initial discoveries were made retain their leading positions among high-paying positions for decades.
Pioneer locations are more likely to arise in areas with universities and high skilled labor pools.
Five Stylized Facts on Disruptive Technologies
The development and initial employment of disruptive technologies are highly concentrated geographically.
The hiring associated with new technologies gradually spreads over time, leading to region broadening.
The skill level required for tech jobs declines sharply over time, leading to skill broadening.
Low-skill jobs associated with a given technology spread out significantly faster than high-skill jobs.
Pioneer locations retain a long-lasting advantage in high-skilled jobs.
Data Sources
Full text of USPTO patents (1976-2016)
Typically follow a research paper format – invention title, abstract, claim, description.
Transcripts of Earnings Conference Calls (2002-19)
Discussions of 300k+ quarterly earnings by 12k publicly listed firms.
Typically contains management presentation followed by analyst Q & A.
Full text of 200M+ online job postings from BG (2007, 2010-19).
Scraped from job forums (e.g., Glassdoor.com) and employer websites.
Geo-coded and assigned to SOC Codes
Step 1: Identify Technical Bigrams from Patents
Use the list of 35,063 technical bigrams associated with influential inventions to identify and document the diffusion of 29 disruptive technologies across firms and labor markets in the U.S.
Extract all (17M+) bigrams US patents (1976-2016)
Remove common bigrams used before 1970 (Corpus of Historical American English)
Keep bigrams that account for at least 1000 citations.
Top Bigrams in Patents
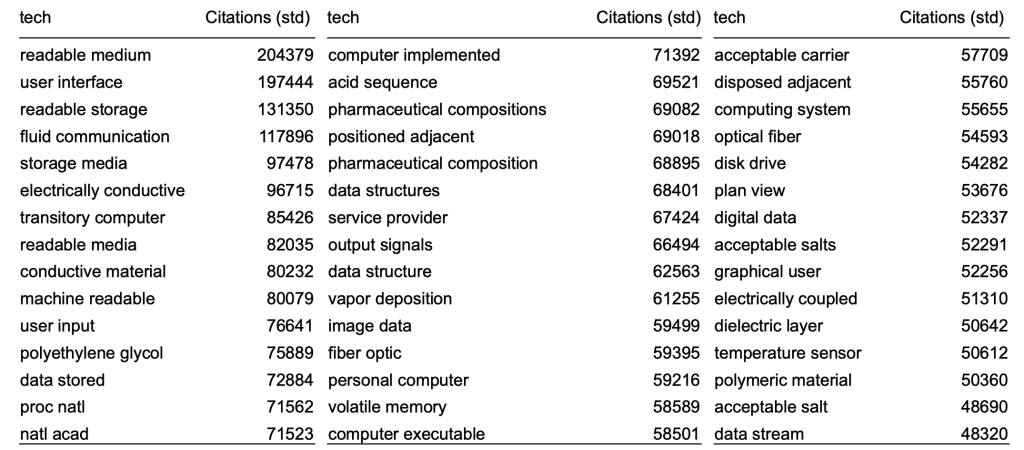
Fig. 14 Top Bigrams in Patents#
Step 2: Identify Disruptive Technologies from Earnings Calls
Identify technical bigrams that are discussed in earnings calls with increasing frequency, while keeping those that are below 10% of the maximum frequency in the first year. This results in a total of 305 technical bigrams.
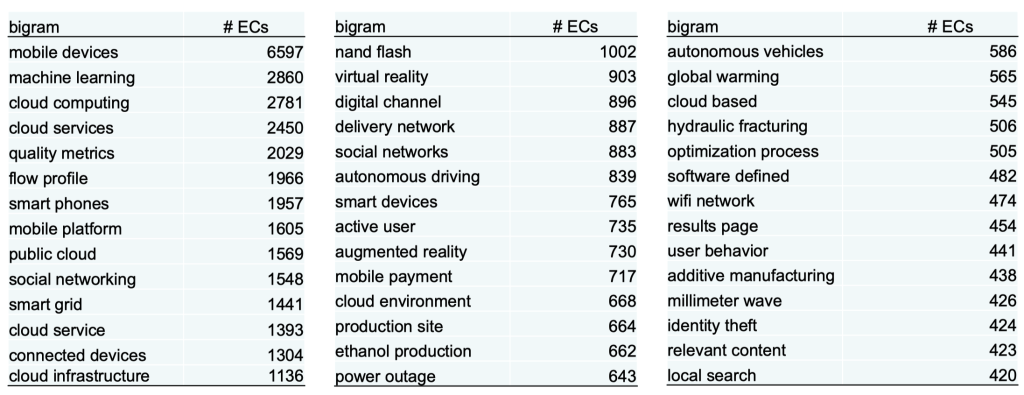
Fig. 15 Technical bigrams in earnings calls#
Technical vs non-technical bigrams
Non-technical bigrams refer to bigrams that appear in earnings calls but not in patents.
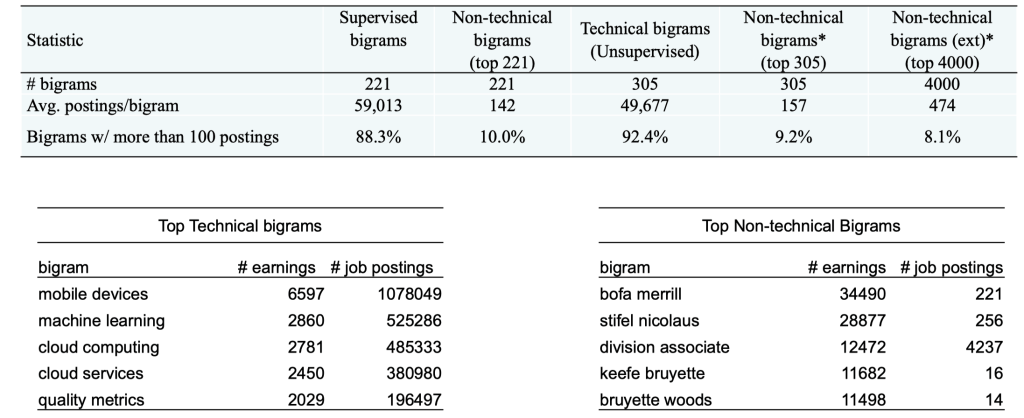
Fig. 16 Technical vs non-technical bigrams#
Step 3: Bigrams to Technologies
There are two alternative approaches:
The “Supervised” approach groups bigrams with similar meaning to measure the spread of 29 specific technologies. This approach involves adding synonyms and manually auditing each bigram. Examples include grouping “smartphone tablet” and “android phones” under “Smart Devices” and grouping “3d printer” and “additive manufacturing” under “3D printing.”
The “Unsupervised” approach treats each technical bigram as a separate technology without any further intervention. This approach is used as a robustness check.
Technology Exposure
The technology exposure is measured at the patent, earnings call, and job level using the following formula:
\(\text{exposure}{i,\tau,t} = 1{b{t} \in D_{i,t}}\)
Here, \(D_{i,t}\) refers to the set of bigrams present in a job posting or earnings call made at time \(t\), and \(b_{\tau}\) is a bigram linked to technology \(\tau\).
Example Jobs Exposed to Smart Devices
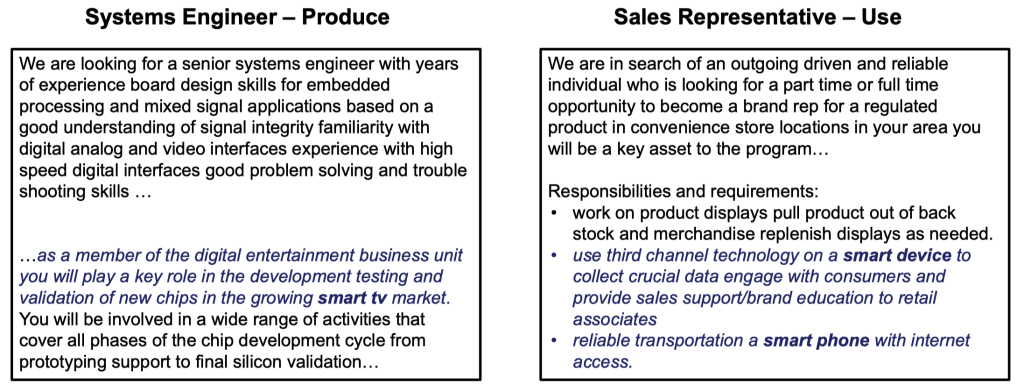
Fig. 17 Example Jobs Exposed to Smart Devices#
The average number of job postings containing a technical bigram is 59,013, while the average number of mentions of top non-technical bigrams in earnings calls is 157.
Define an Emergence Year for each Technology
To define an emergence year for each technology, the following steps are taken:
The share of earnings calls mentioning a technology is measured.
The year when the time series first reaches at least 10% of its maximum is defined as the “technology year of emergence”.
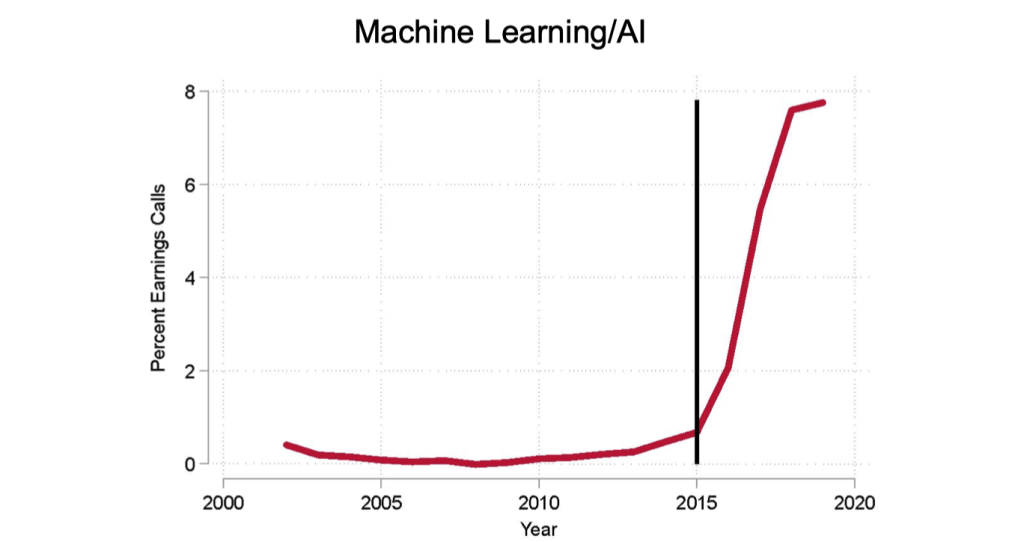
Fig. 18 Technology Emergence Years#
Share Exposed Firms and Job Postings – Corr. 80%
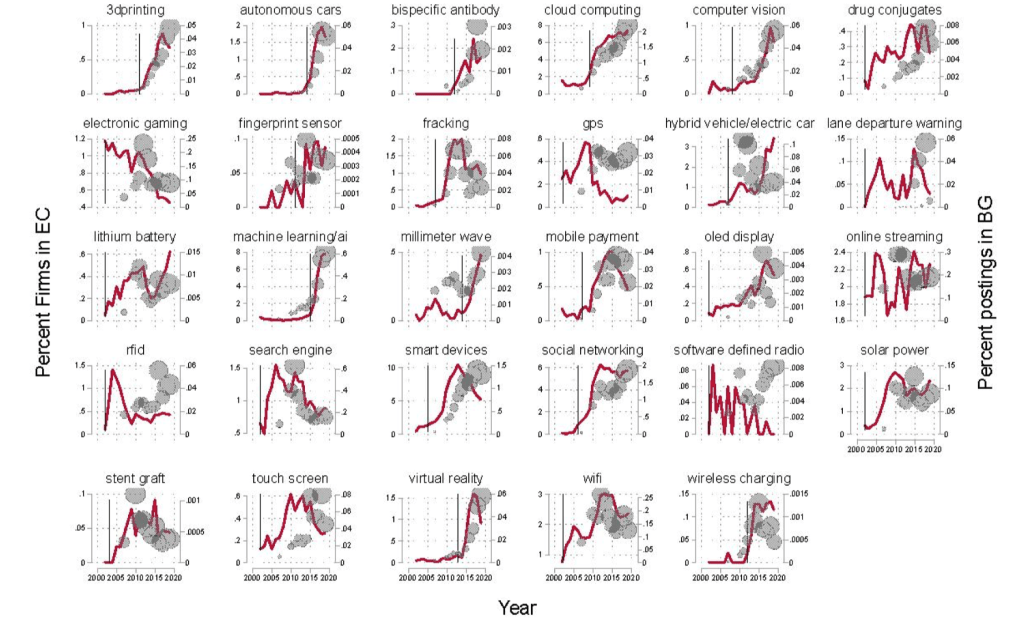
Fig. 19 Share Exposed Firms and Job Postings – Corr. 80%#
Pioneer Locations
The pioneer locations are identified as the geographical locations that account for 50% of the technology patents 10 years prior to the year of emergence.
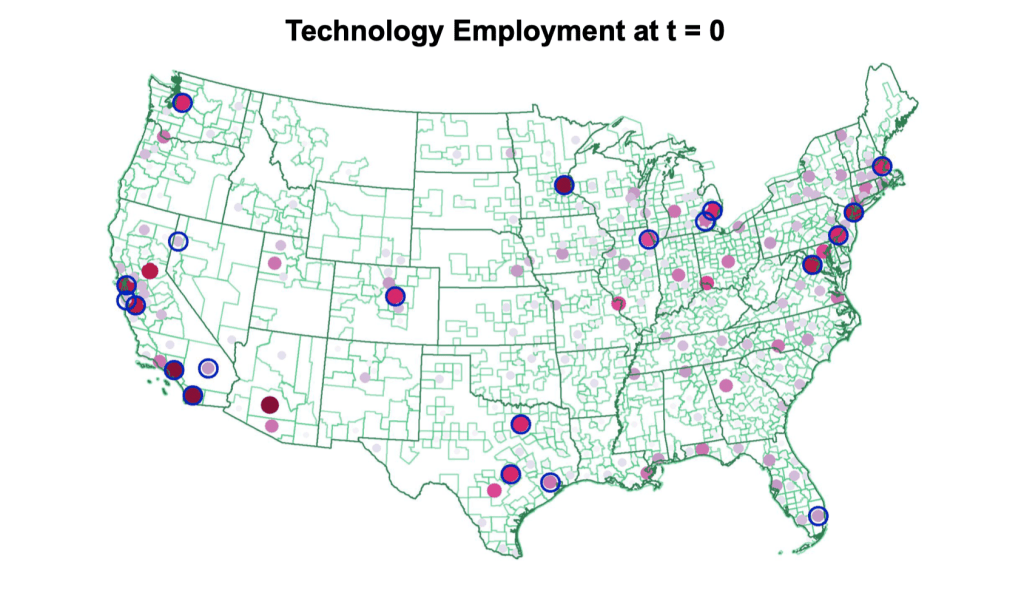
Fig. 20 Pioneer Locations#
Broadening over Time and Pioneer Locations
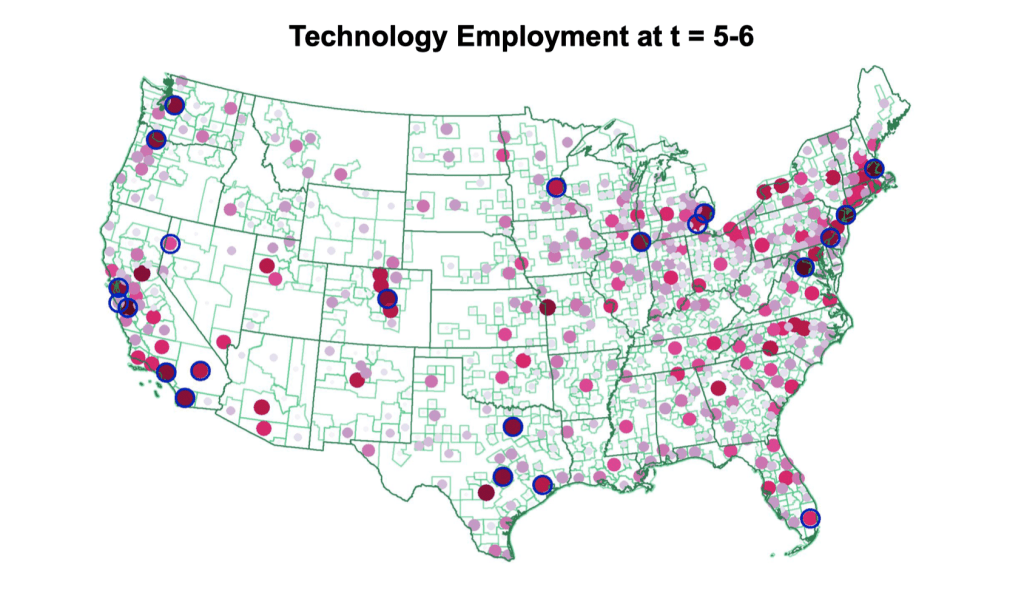
Fig. 21 Broadening over Time and Pioneer Locations#
When Words Sweat#
Netzer et al. [2019]
esearchers analyzed text from thousands of loan requests from an online crowdfunding platform.
Borrowers’ intentions, circumstances, and personality traits were detected in the text and were found to be predictive of default up to three years later.
The text analysis was able to detect signals that the borrowers may not have been aware of or intentionally conveyed.
The study shows the potential of using natural language processing techniques to improve credit risk assessments.
Suppose you are considering lending $2,000 to one of two borrowers on a crowdfunding website, both with similar financial and demographic characteristics. However, their loan applications differ in their text:
Borrower #1:
“I am hardworking, married for 25 years, and have two wonderful boys. I need a $2,000 loan to fix our roof. Thank you, God bless you, and I promise to pay you back.”
Borrower #2:
“I need a $2,000 loan to cover the cost of repairing my roof. I pay all bills on time.”
Which borrower is more likely to default?
Loan requests written by defaulting borrowers tend to include words related to family, financial and general hardship, mentions of God, and the near future. They may also plead for help and use present or future tense verbs. This suggests that borrower #1 may be more likely to default.
Loan Application Words Predicting Repayment
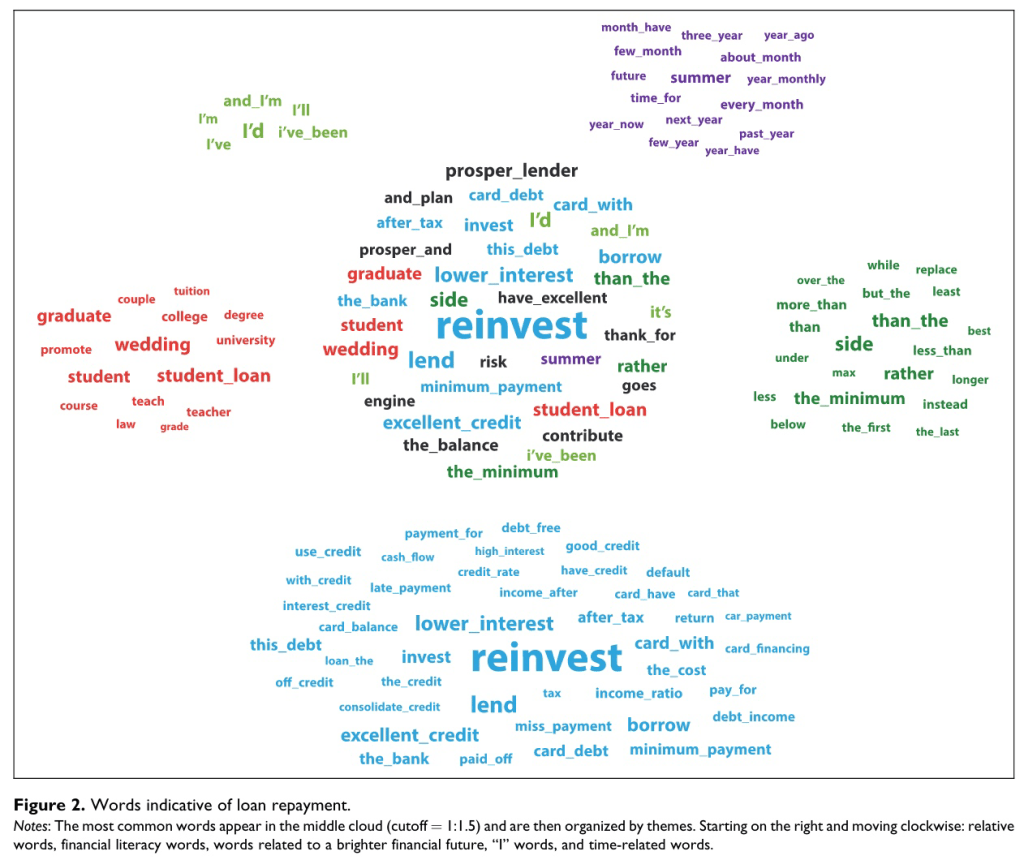
Fig. 22 Words Predicting Repayment#
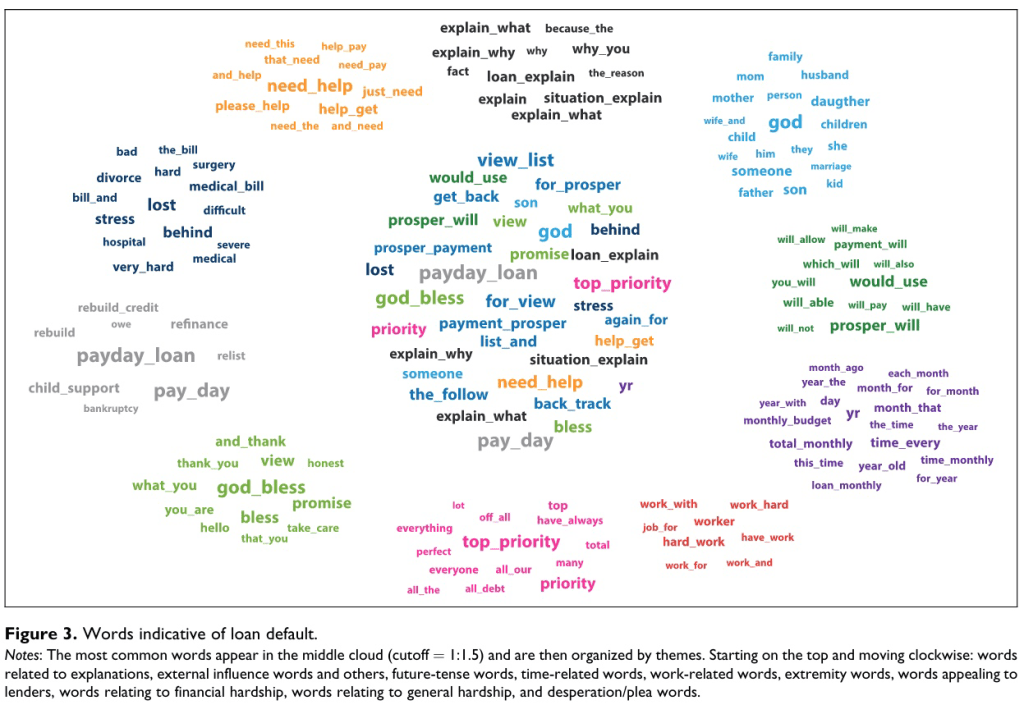
Fig. 23 Words Predicting Default#
The Legislative Influence Detector#
Burgess et al. [2016]
State legislatures introduce over 45,000 bills each year.
Legislators frequently copy text from other states or interest groups when drafting bills.
Existing approaches to detecting text reuse are slow, biased, and incomplete.
The Legislative Influence Detector (LID) uses the Smith-Waterman local alignment algorithm to detect sequences of text that occur in model legislation and state bills.
LID has found over 45,000 instances of bill-to-bill text reuse and over 14,000 instances of model-legislation-to-bill text reuse.
LID reduces the time it takes to manually find text reuse from days to seconds.
Interest Group Influence
The study focuses on two major interest group associations: ALEC (conservative) and ALICE (liberal).
These associations represent a large number of interest groups, with ALEC representing the National Rifle Association (NRA) and ALICE representing major labor associations.
Both ALEC and ALICE have thousands of model bills covering various topics such as labor rights, voting regulations, environmental issues, and economic issues.
The main goal of these associations is to provide a database of model legislation for politicians and activists to implement in state legislatures.
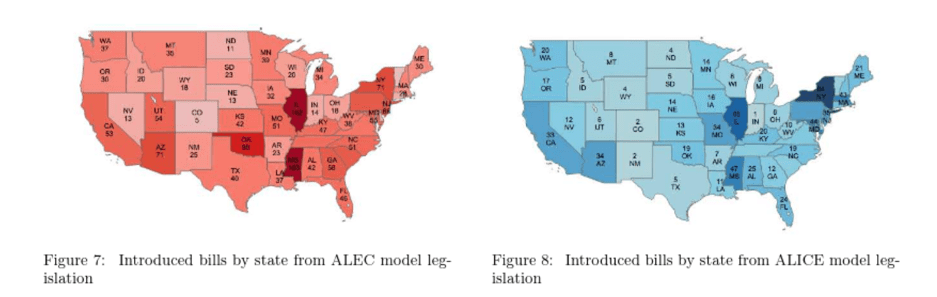
Fig. 24 ALEC and ALICE#
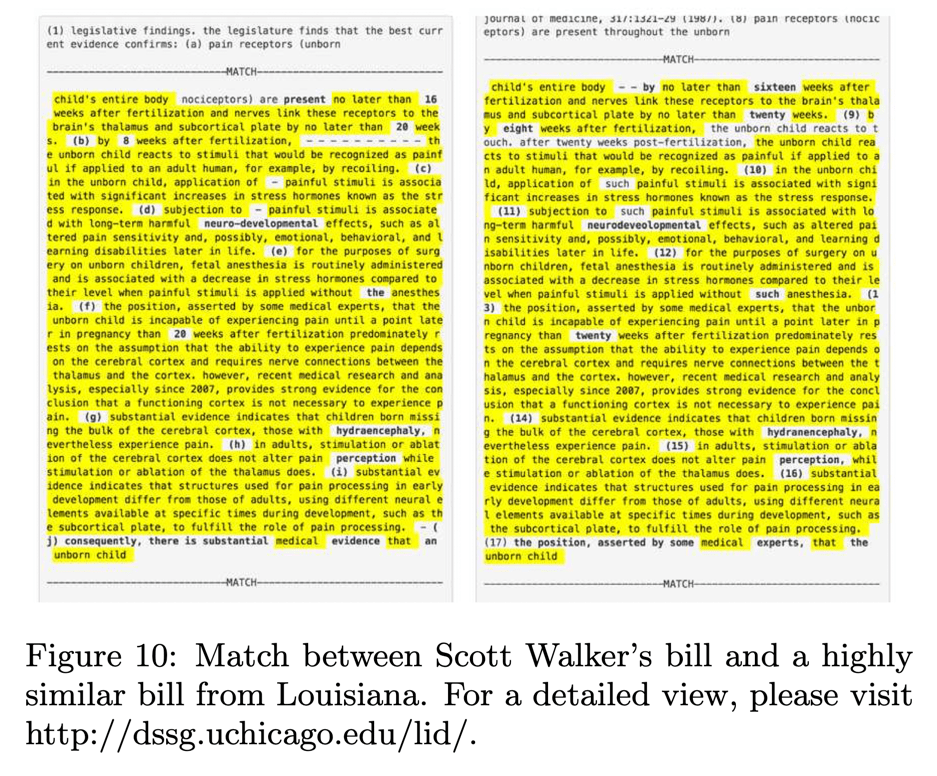
Fig. 25 Match between Scott Walker’s bill and a bill from Louisiana#
From Pork to Policy#
Catalinac [2018]
The study examines how candidates adopt different electoral strategies under different electoral systems and intraparty competition.
The researchers analyzed 7,497 Japanese-language candidate election manifestos from before and after Japan’s 1994 electoral reform using probabilistic topic modeling and qualitative interpretations.
The findings suggest that the reform, which eliminated intraparty competition, led to a decline in particularism and an increase in promises of programmatic goods such as national security among candidates affiliated with Japan’s Liberal Democratic Party.
This change is not explained by the entry of new candidates or other variables that could increase discussion of national security.
Opposition candidates relied on programmatic goods under both electoral systems, consistent with the theory.
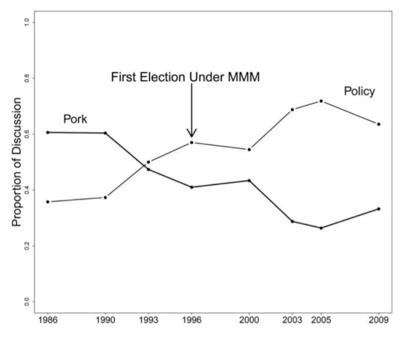
Fig. 26 From Pork to Policy#
Transparency and Deliberation Within the FOMC#
Hansen et al. [2018]
The study examines how transparency affects monetary policymakers’ deliberations in the Federal Open Market Committee (FOMC).
Computational linguistics algorithms are used to analyze communication patterns.
A natural experiment in the FOMC in 1993 is used to explore the positive discipline effect and negative conformity effect.
Large changes in communication patterns are found after transparency.
A difference-in-differences approach is used to identify evidence for both effects.
An influence measure is constructed, suggesting that the discipline effect dominates.
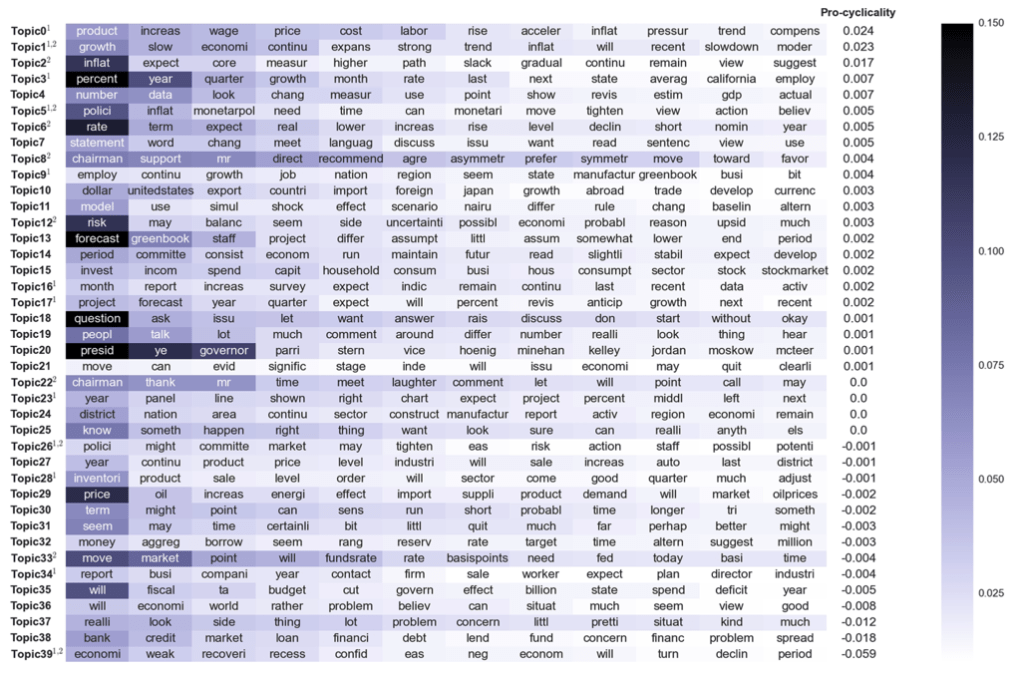
Fig. 27 Topic distributions#
Pro-Cyclical Topics
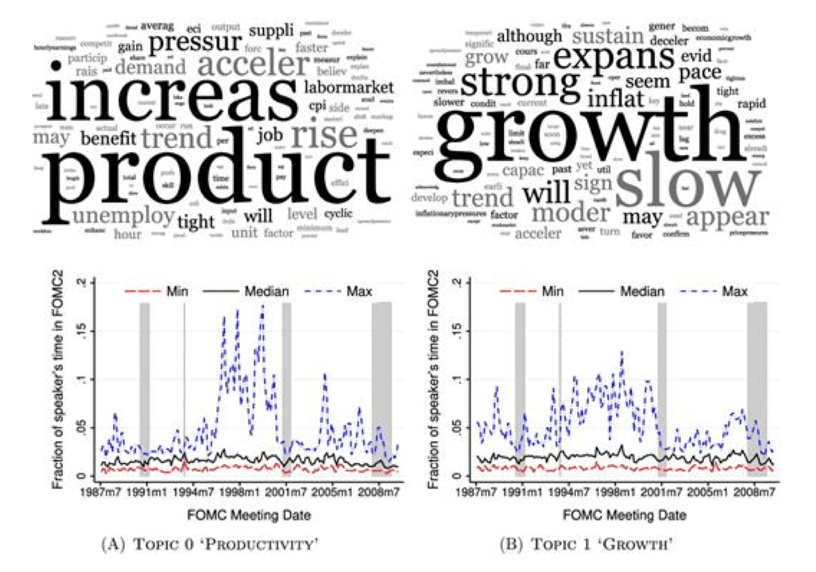
Fig. 28 Pro-Cyclical Topics#
Counter-Cyclical Topics
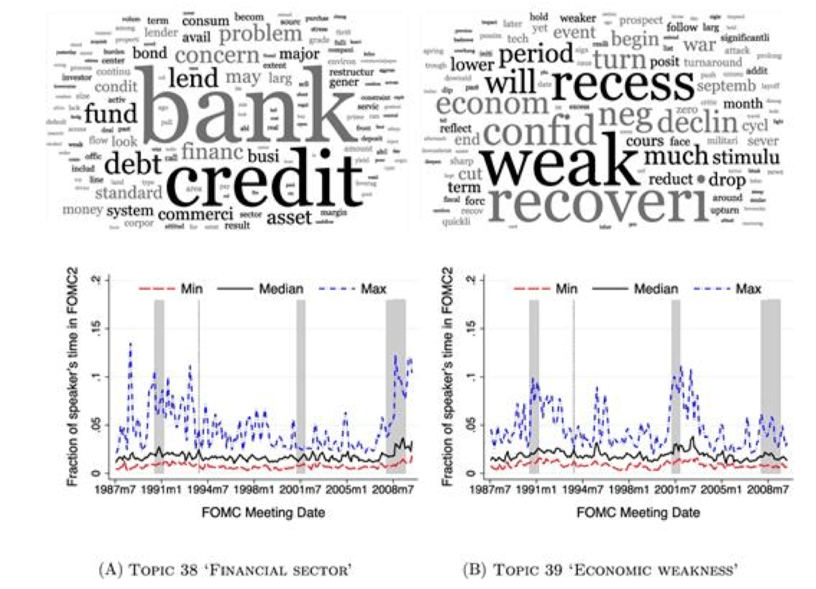
Fig. 29 Counter-Cyclical Topics#
Effect of Transparency
In 1993, the public availability of transcripts caused an unexpected transparency shock.
The impact of increasing transparency includes:
Higher use of discipline and technocratic language, which is likely beneficial.
Higher conformity, which is likely costly.
These findings highlight the tradeoffs that come with transparency in bureaucratic organizations.
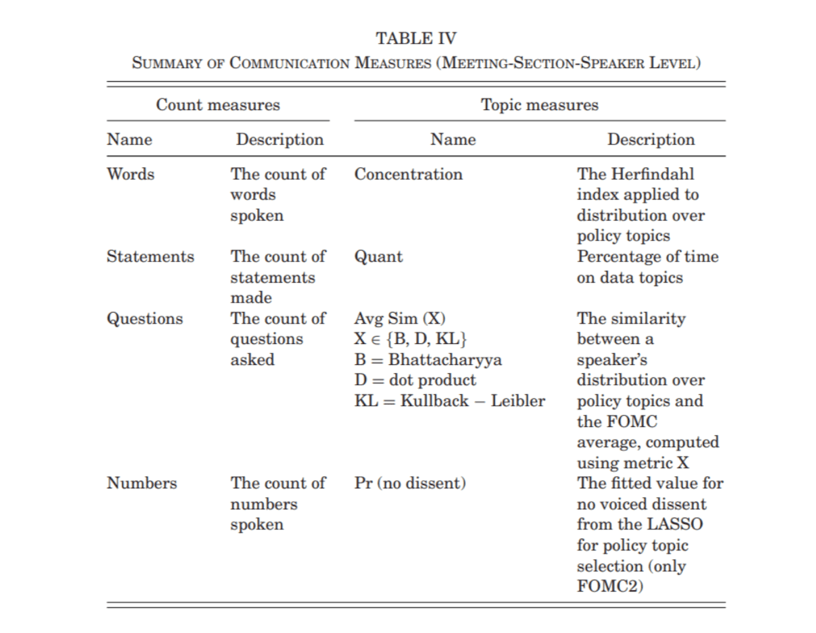
Fig. 30 Effect of Transparency#
Adjusting for Confounding with Text Matching#
Roberts et al. [2020]
This paper proposes a method to adjust for confounding in observational studies using text matching.
Matching on text is particularly useful in situations where confounding factors cannot be observed or measured directly.
The proposed method involves estimating a low-dimensional summary of the text and using it to match treated and control units.
The method, called topical inverse regression matching, matches on both the topical content of confounding documents and the probability that each document is treated.
The effectiveness of the method is demonstrated through two applications: the effect of author gender on citation counts in international relations literature and the effects of censorship on Chinese social media users.
Application to online censorship in China
Gathered a dataset of Chinese social media posts, including both censored and uncensored posts, from 593 bloggers over a period of six months, totaling 150,000 posts.
Utilized a modified version of propensity score matching to identify nearly identical posts, some of which were censored and some of which were not.
Measured the censorability of subsequent posts using their text and analyzed whether censorship had a deterrence or backlash effect.
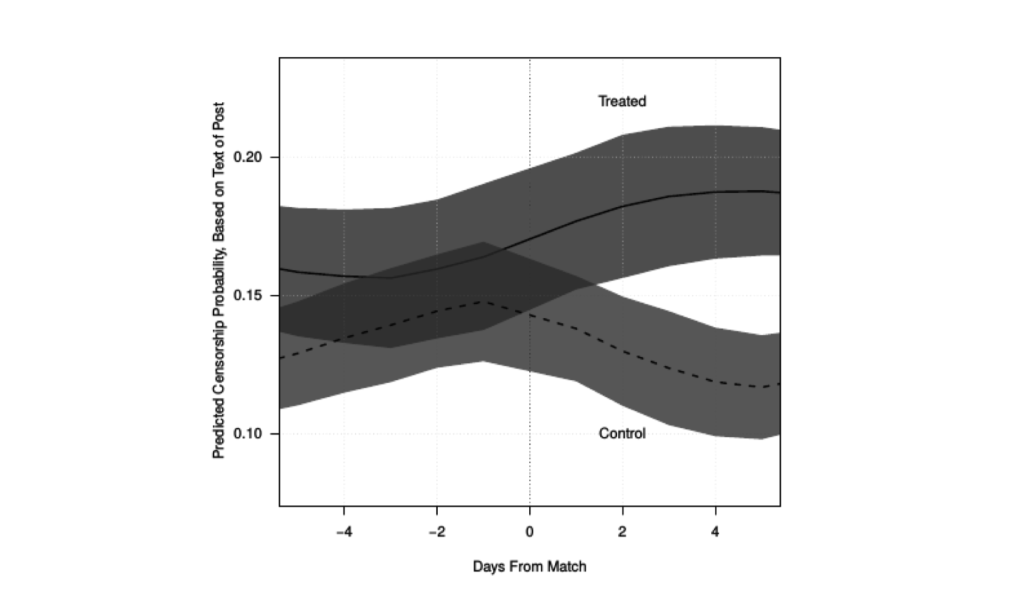
Fig. 31 Censorship has a backlash effect#
Bloggers who are censored respond with more censorable content.
Deciphering Monetary Policy Board Minutes with Text Mining#
Lee et al. [2019]
The study uses text mining to analyze Monetary Policy Board (MPB) minutes of Bank of Korea (BOK).
A field-specific Korean dictionary and contiguous sequences of words (n-grams) are used to capture central bank communication subtleties.
Text-based indicators help explain current and future BOK monetary policy decisions in conjunction with an augmented Taylor rule, indicating additional information beyond macroeconomic variables.
The text-based indicators outperform English-based textual classifications, media-based measure of economic policy uncertainty, and databased measure of macroeconomic uncertainty.
The study highlights the importance of using a field-specific dictionary and the original Korean text in the analysis.
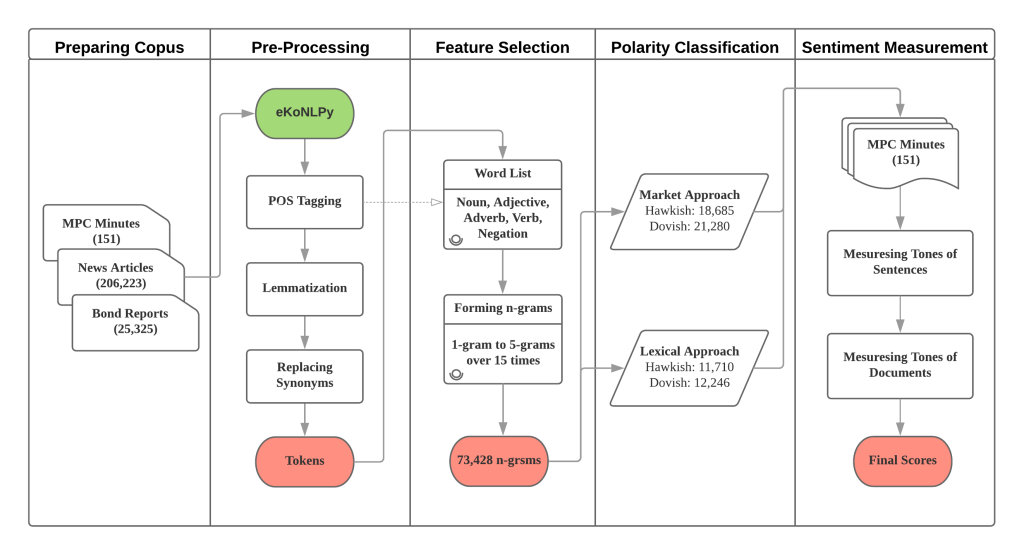
Fig. 32 Procedure of the study#
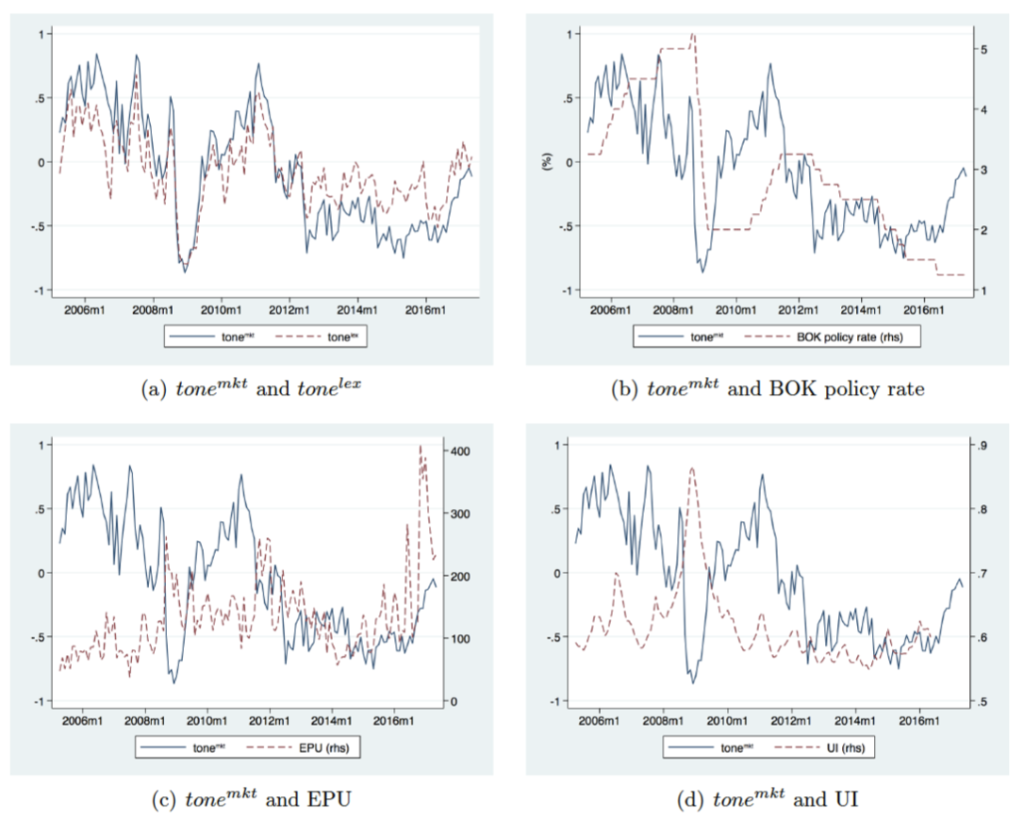
Fig. 33 Text-Based Indicators of MP Sentiments#