Monetary Policy Shocks#
Christiano, Lawrence J., Martin Eichenbaum, and Charles L. Evans. 1999. “Monetary Policy Shocks: What Have We Learned and to What End?”
%config InlineBackend.figure_format='retina'
from ekorpkit import eKonf

eKonf.setLogger("WARNING")
print("version:", eKonf.__version__)
print("is notebook?", eKonf.is_notebook())
print("is colab?", eKonf.is_colab())
print("evironment varialbles:")
eKonf.print(eKonf.env().dict())
INFO:ekorpkit.base:IPython version: (6, 9, 0), client: jupyter_client
INFO:ekorpkit.base:Google Colab not detected.
version: 0.1.35+0.g69734d6.dirty
is notebook? True
is colab? False
evironment varialbles:
{'CUDA_DEVICE_ORDER': None,
 'CUDA_VISIBLE_DEVICES': None,
 'EKORPKIT_CONFIG_DIR': '/workspace/projects/ekorpkit-book/config',
 'EKORPKIT_DATA_DIR': None,
 'EKORPKIT_LOG_LEVEL': 'WARNING',
 'EKORPKIT_PROJECT': 'ekorpkit-book',
 'EKORPKIT_WORKSPACE_ROOT': '/workspace',
 'KMP_DUPLICATE_LIB_OK': 'TRUE',
 'NUM_WORKERS': 230}
start_year = 1999
data_dir = "../data/fomc"
eKonf.env().FRED_API_KEY
pydantic.types.SecretStr
import numpy as np

ids = {
    "GDPC1": "Real GDP",
    "PCECC96": "Real Consumption",
    "GDPDEF": "GDP Deflator",
    "GPDIC1": "Real investment",
    "COMPRNFB": "Real wage",
    "OPHNFB": "Labor productivity",
    "FEDFUNDS": "Federal funds rate",
    "CP": "Real profit",
    "M2SL": "M2 Growth",
    "SP500": "SP500",
    "CPIAUCSL": "CPI",
}
cols = list(ids.keys())

cfg = eKonf.compose("io/fetcher=quandl")
cfg.series_name = "value"
cfg.series_id = cols
# cfg.force_download = True
quandl = eKonf.instantiate(cfg)

econ_data = quandl.data.reset_index()


cfg = eKonf.compose("pipeline/pivot")
cfg.index = "date"
cfg.columns = "series_id"
cfg.values = ["value"]
econ_data_pivot = eKonf.pipe(econ_data, cfg)


econ_data_pivot = econ_data_pivot.set_index("date").resample("Q").last()
cols.remove("M2SL")
econ_data_pivot[cols] = np.log(econ_data_pivot[cols])
econ_data_pivot["M2SL"] = econ_data_pivot.M2SL.pct_change()
econ_data_pivot
INFO:ekorpkit.base:Applying pipe: functools.partial(<function pivot at 0x7f4a921e4af0>)
| series_id | COMPRNFB | CP | CPIAUCSL | FEDFUNDS | GDPC1 | GDPDEF | GPDIC1 | M2SL | OPHNFB | PCECC96 | SP500 |
|---|---|---|---|---|---|---|---|---|---|---|---|
| date | |||||||||||
| 1946-03-31 | NaN | NaN | NaN | NaN | NaN | NaN | NaN | NaN | NaN | NaN | NaN |
| 1946-06-30 | NaN | NaN | NaN | NaN | NaN | NaN | NaN | NaN | NaN | NaN | NaN |
| 1946-09-30 | NaN | NaN | NaN | NaN | NaN | NaN | NaN | NaN | NaN | NaN | NaN |
| 1946-12-31 | NaN | NaN | NaN | NaN | NaN | NaN | NaN | NaN | NaN | NaN | NaN |
| 1947-03-31 | 3.578618 | 3.089678 | 3.091042 | NaN | 7.617981 | 2.480899 | 5.384912 | NaN | 3.144712 | 7.152613 | NaN |
| ... | ... | ... | ... | ... | ... | ... | ... | ... | ... | ... | ... |
| 2021-06-30 | 4.746253 | 7.897441 | 5.601953 | -2.525729 | 9.871394 | 4.765698 | 8.162235 | 0.030493 | 4.723513 | 9.522638 | 8.365789 |
| 2021-09-30 | 4.745236 | 7.908976 | 5.613909 | -2.525729 | 9.877087 | 4.780089 | 8.191378 | 0.026018 | 4.713495 | 9.527514 | 8.368122 |
| 2021-12-31 | 4.751225 | 7.901128 | 5.635240 | -2.525729 | 9.893755 | 4.797343 | 8.269513 | 0.023429 | 4.728865 | 9.533753 | 8.469300 |
| 2022-03-31 | 4.739937 | 7.910851 | 5.661946 | -1.609438 | 9.889790 | 4.817172 | 8.281742 | 0.015165 | 4.709791 | 9.538284 | 8.418568 |
| 2022-06-30 | NaN | NaN | 5.674951 | -0.261365 | NaN | NaN | NaN | -0.002513 | NaN | NaN | 8.238902 |
306 rows × 11 columns
def plot_irfs(
    from_year=1990,
    to_year=2021,
    shock_name="Federal funds rate",
    tone_col=None,
    econ_cols=[
        "COMPRNFB",
        "CP",
        "FEDFUNDS",
        "GDPC1",
        "GDPDEF",
        "GPDIC1",
        "M2SL",
        "OPHNFB",
        "PCECC96",
    ],
):
    _data = econ_data_pivot[
        (econ_data_pivot.index.year >= from_year)
        & (econ_data_pivot.index.year <= to_year)
    ].copy()

    _data = _data[econ_cols]
    _names = {col: ids[col] for col in econ_cols}
    _data.rename(columns=_names, inplace=True)

    if tone_col in fomc_train_tones.columns:
        f_tone_data = fomc_train_tones[[tone_col]].dropna()
        tones_q = f_tone_data.resample("Q").mean()
        _data = _data.merge(
            tones_q[[tone_col]].ffill(), left_index=True, right_index=True
        )

    irfs = fomc.get_irf(_data)
    if shock_name:
        fomc.plot_irf(irfs, shock_name)

    if tone_col in _data.columns:
        fomc.plot_irf(irfs, tone_col)
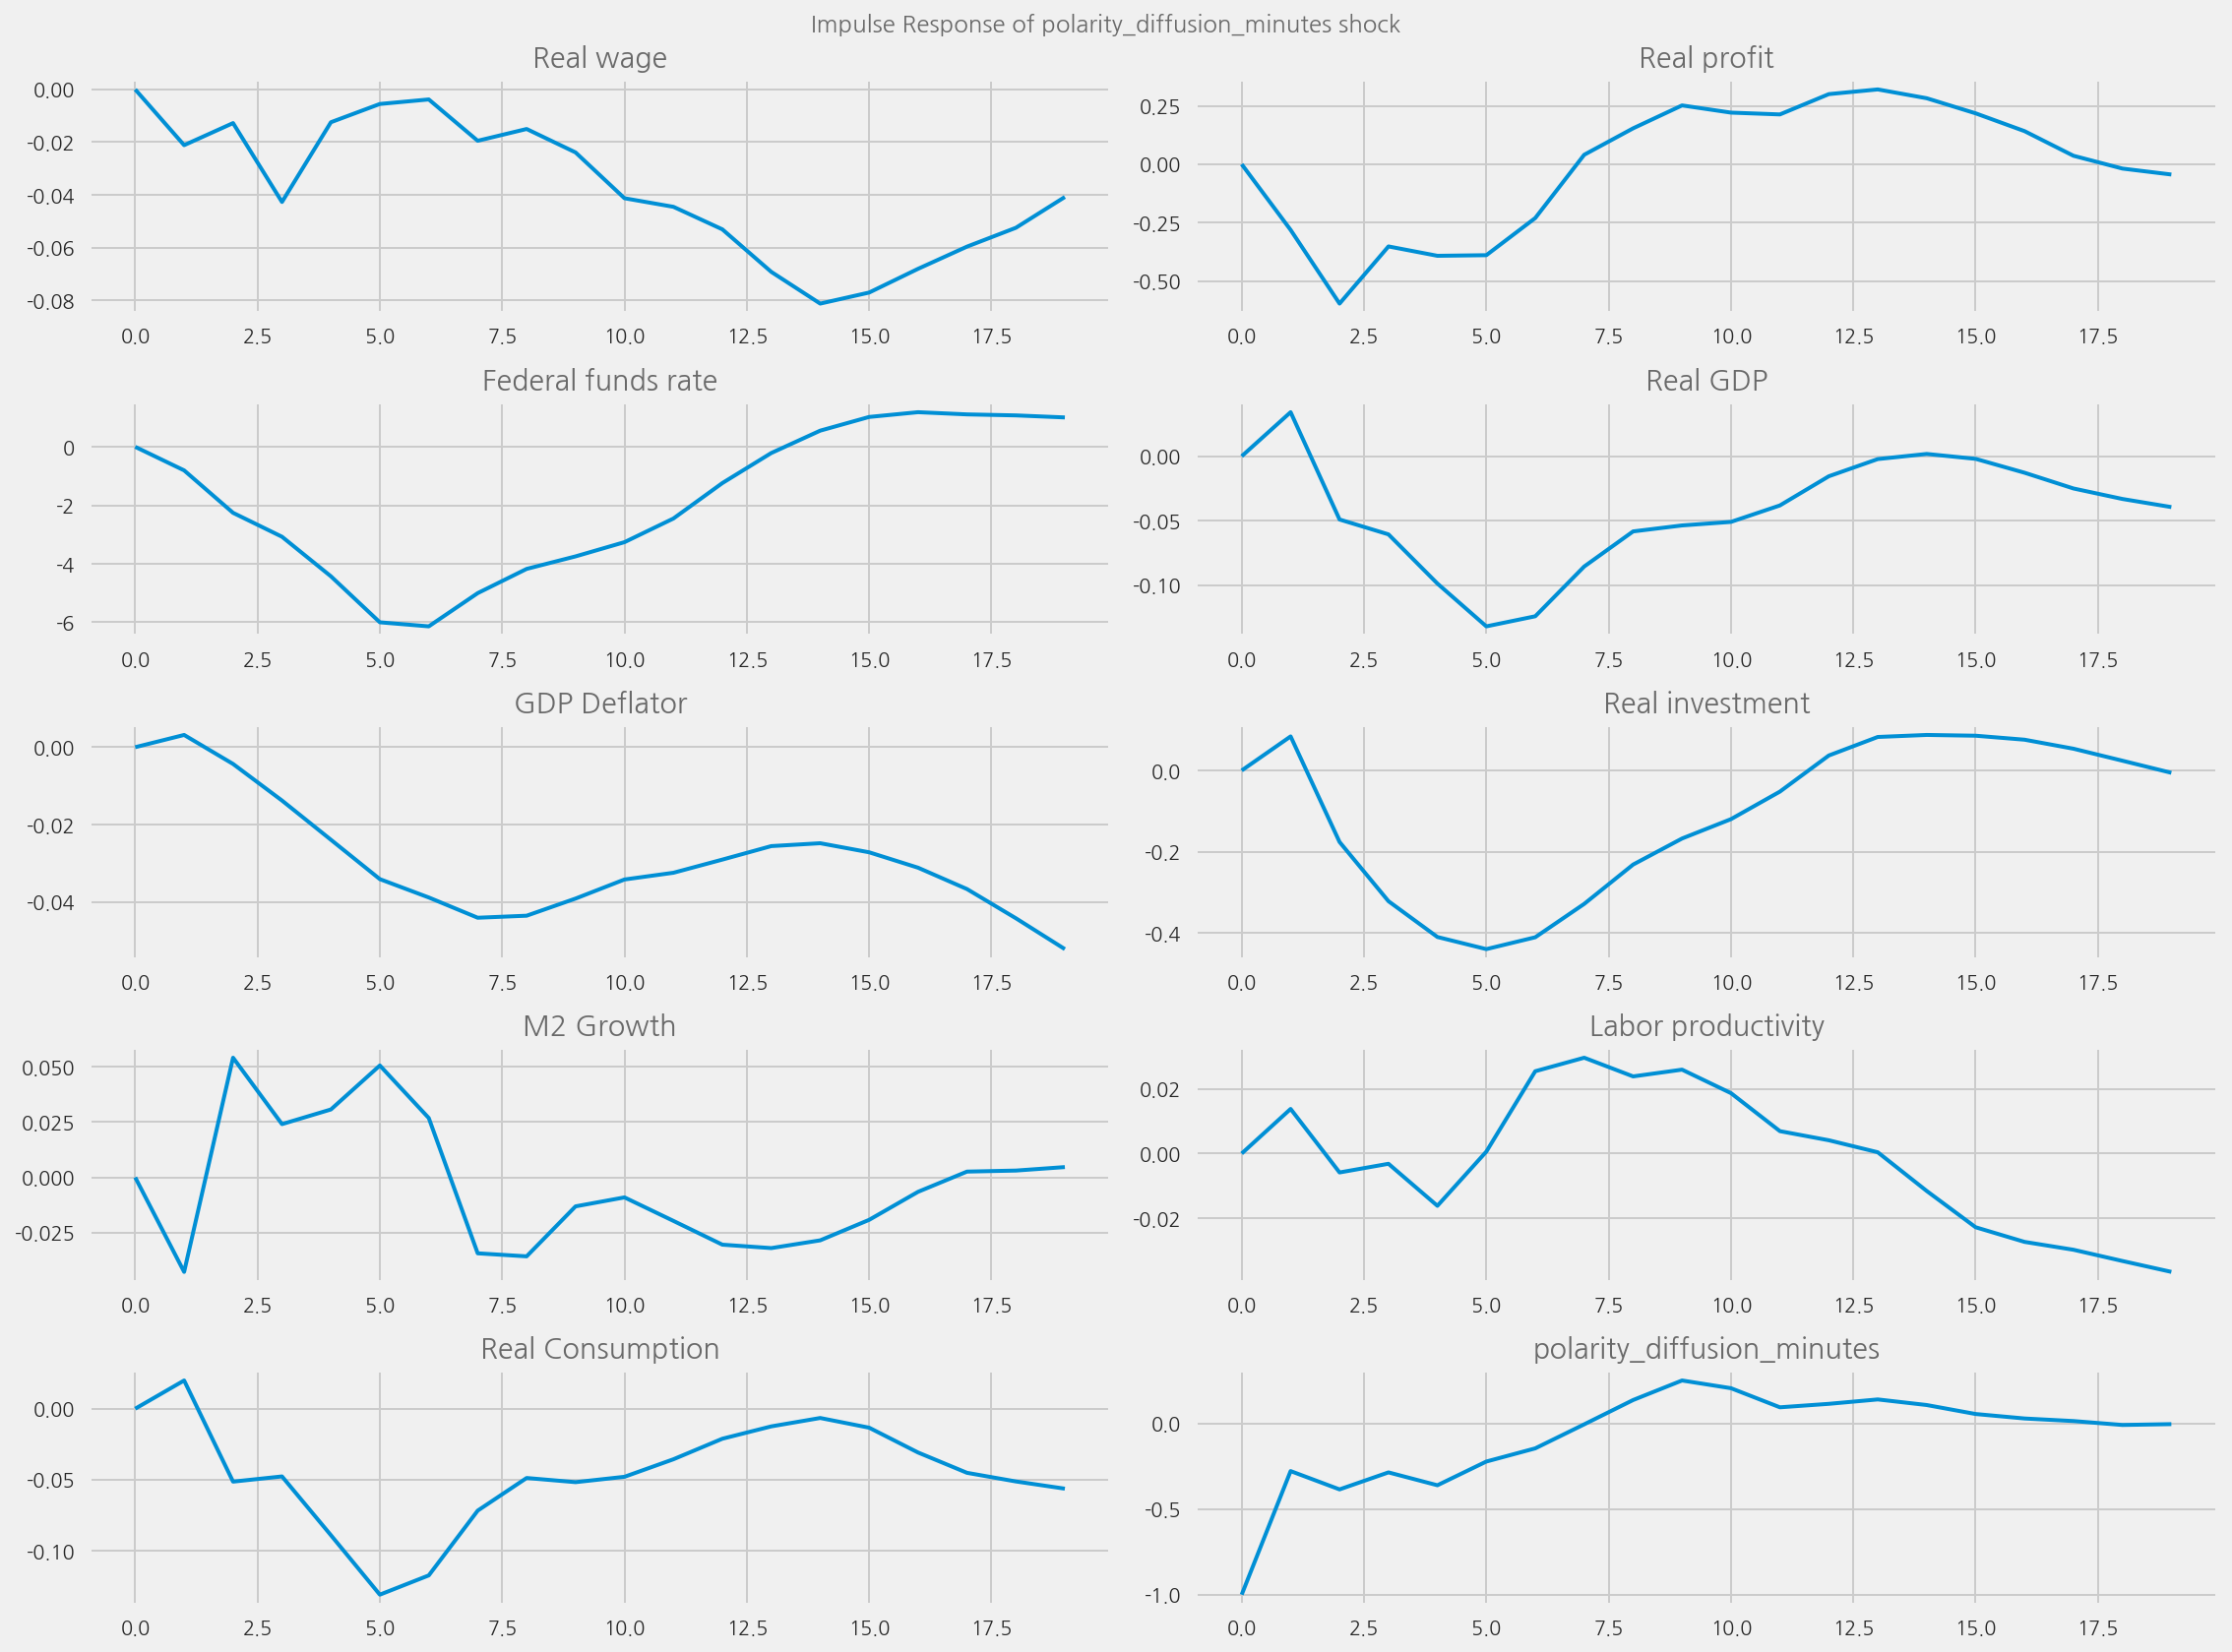
Plot impulse response functions#
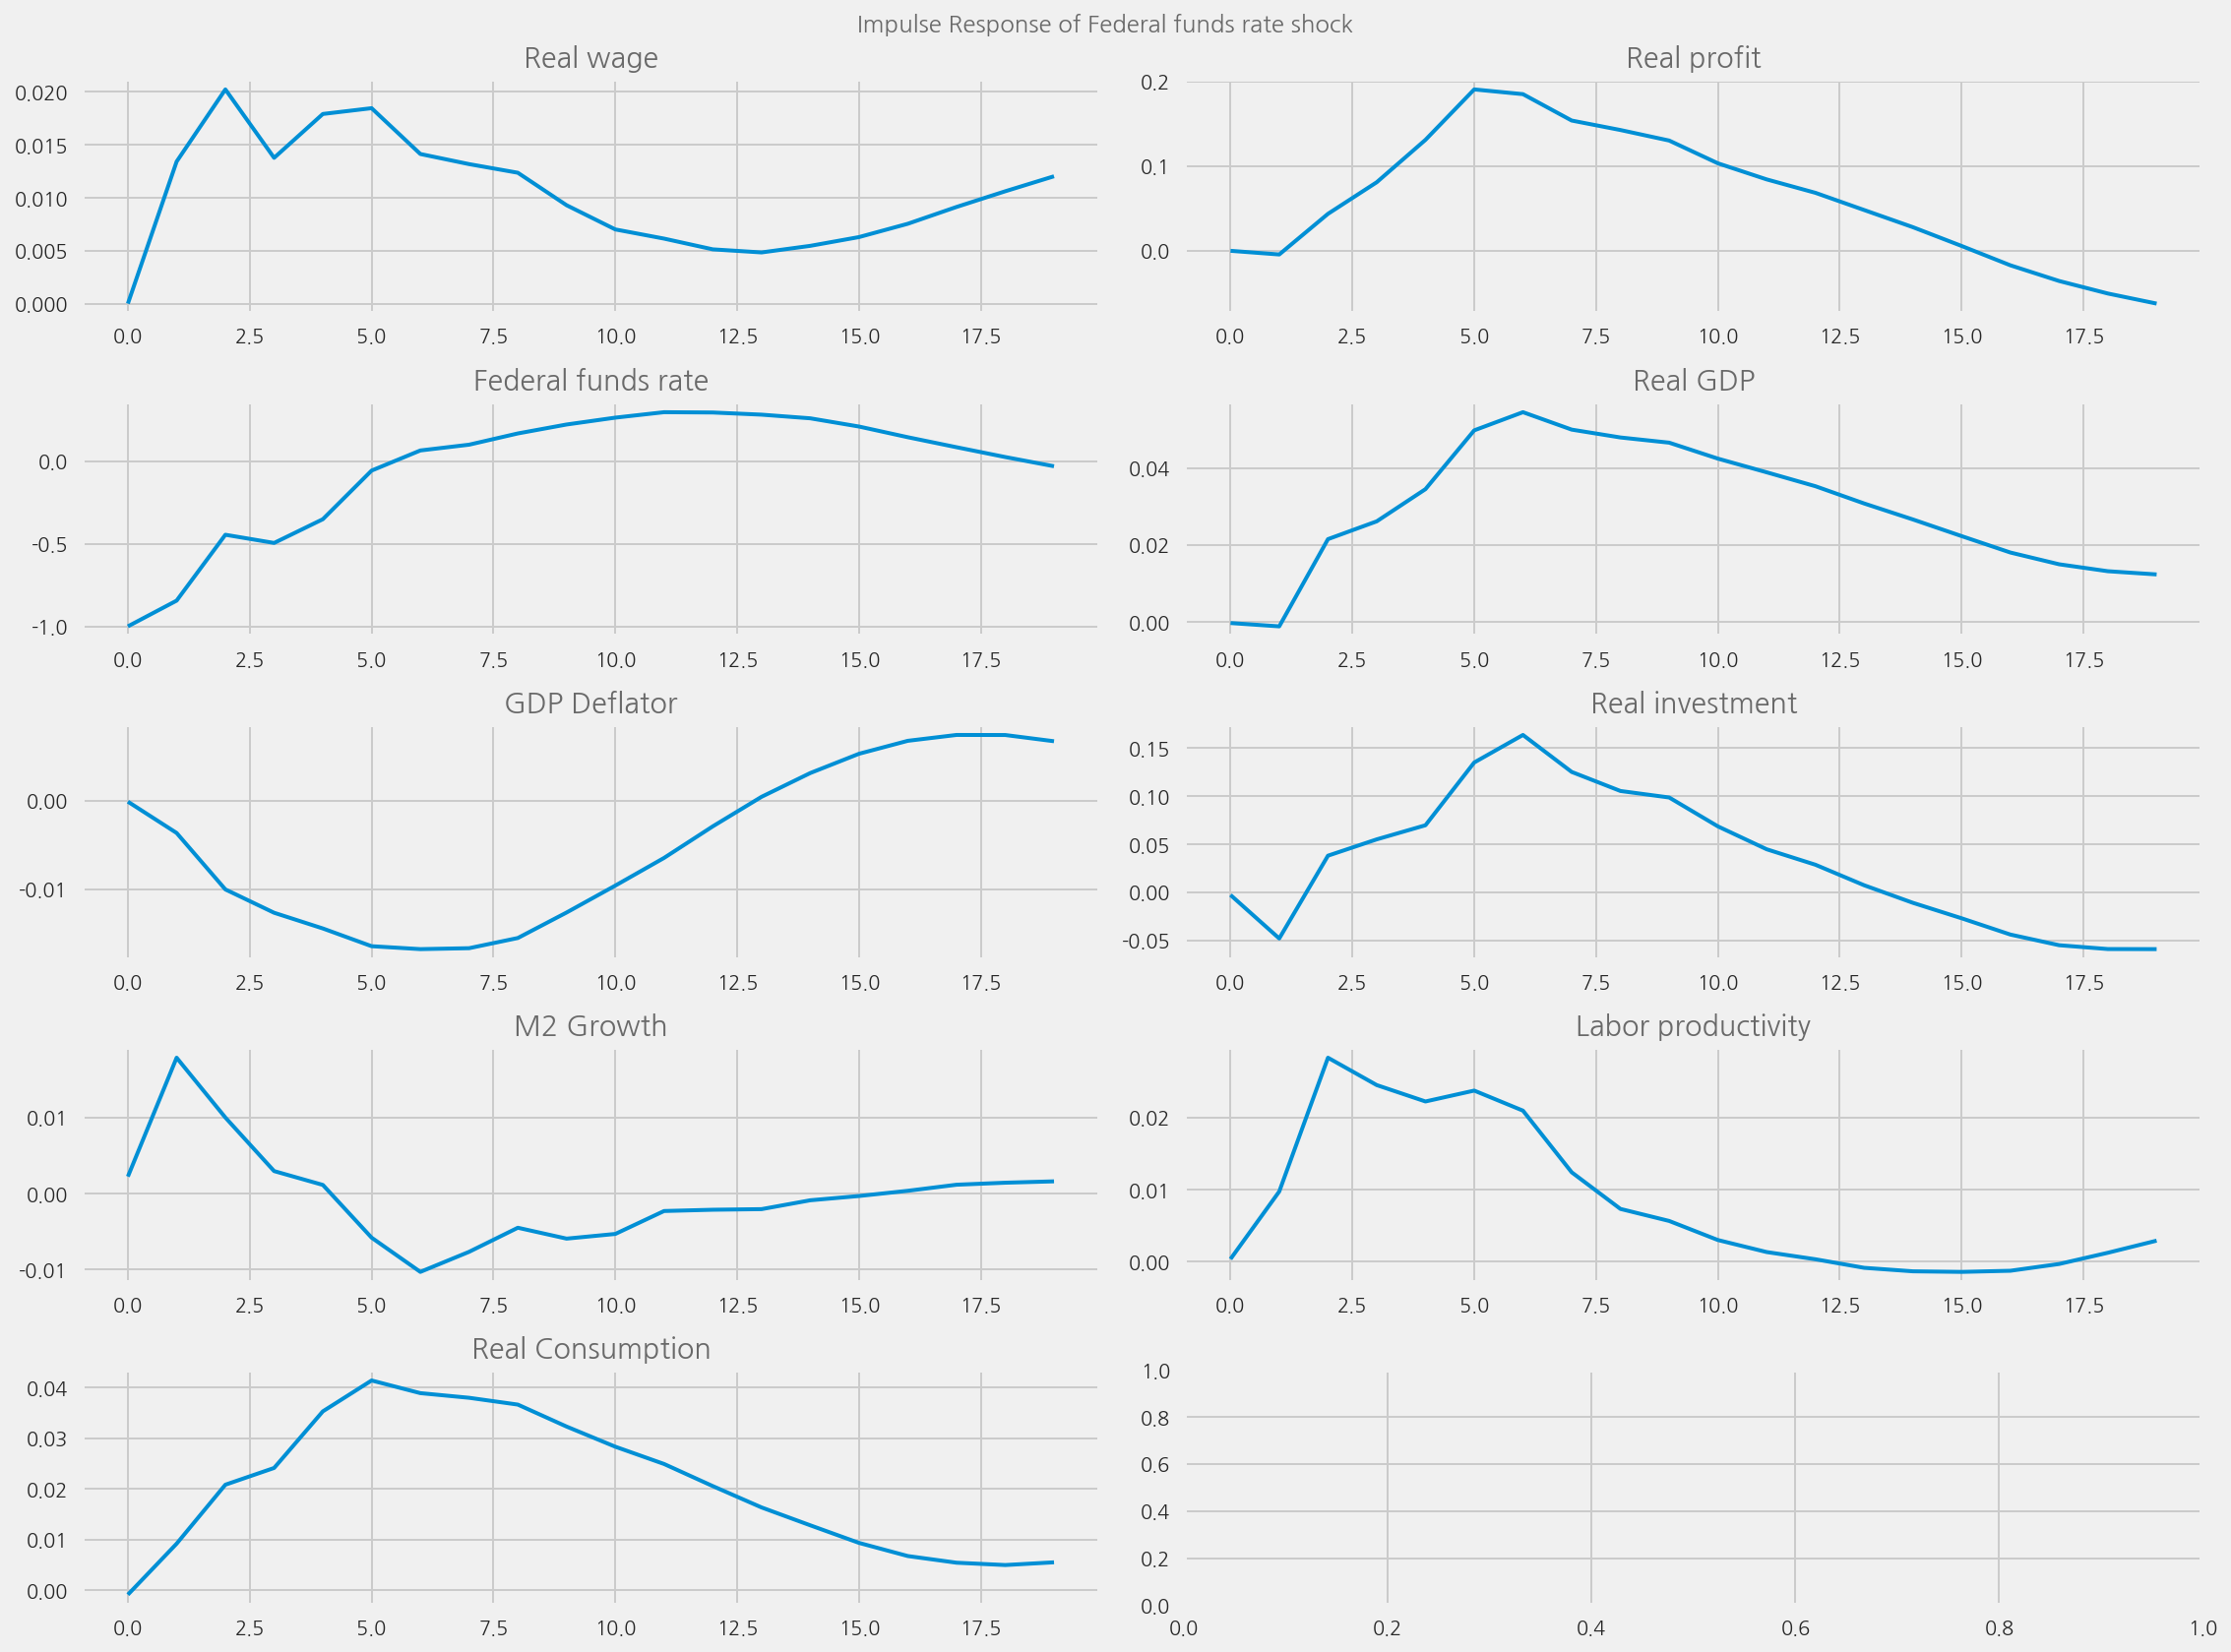
plot_irfs(from_year=1965, to_year=1995)
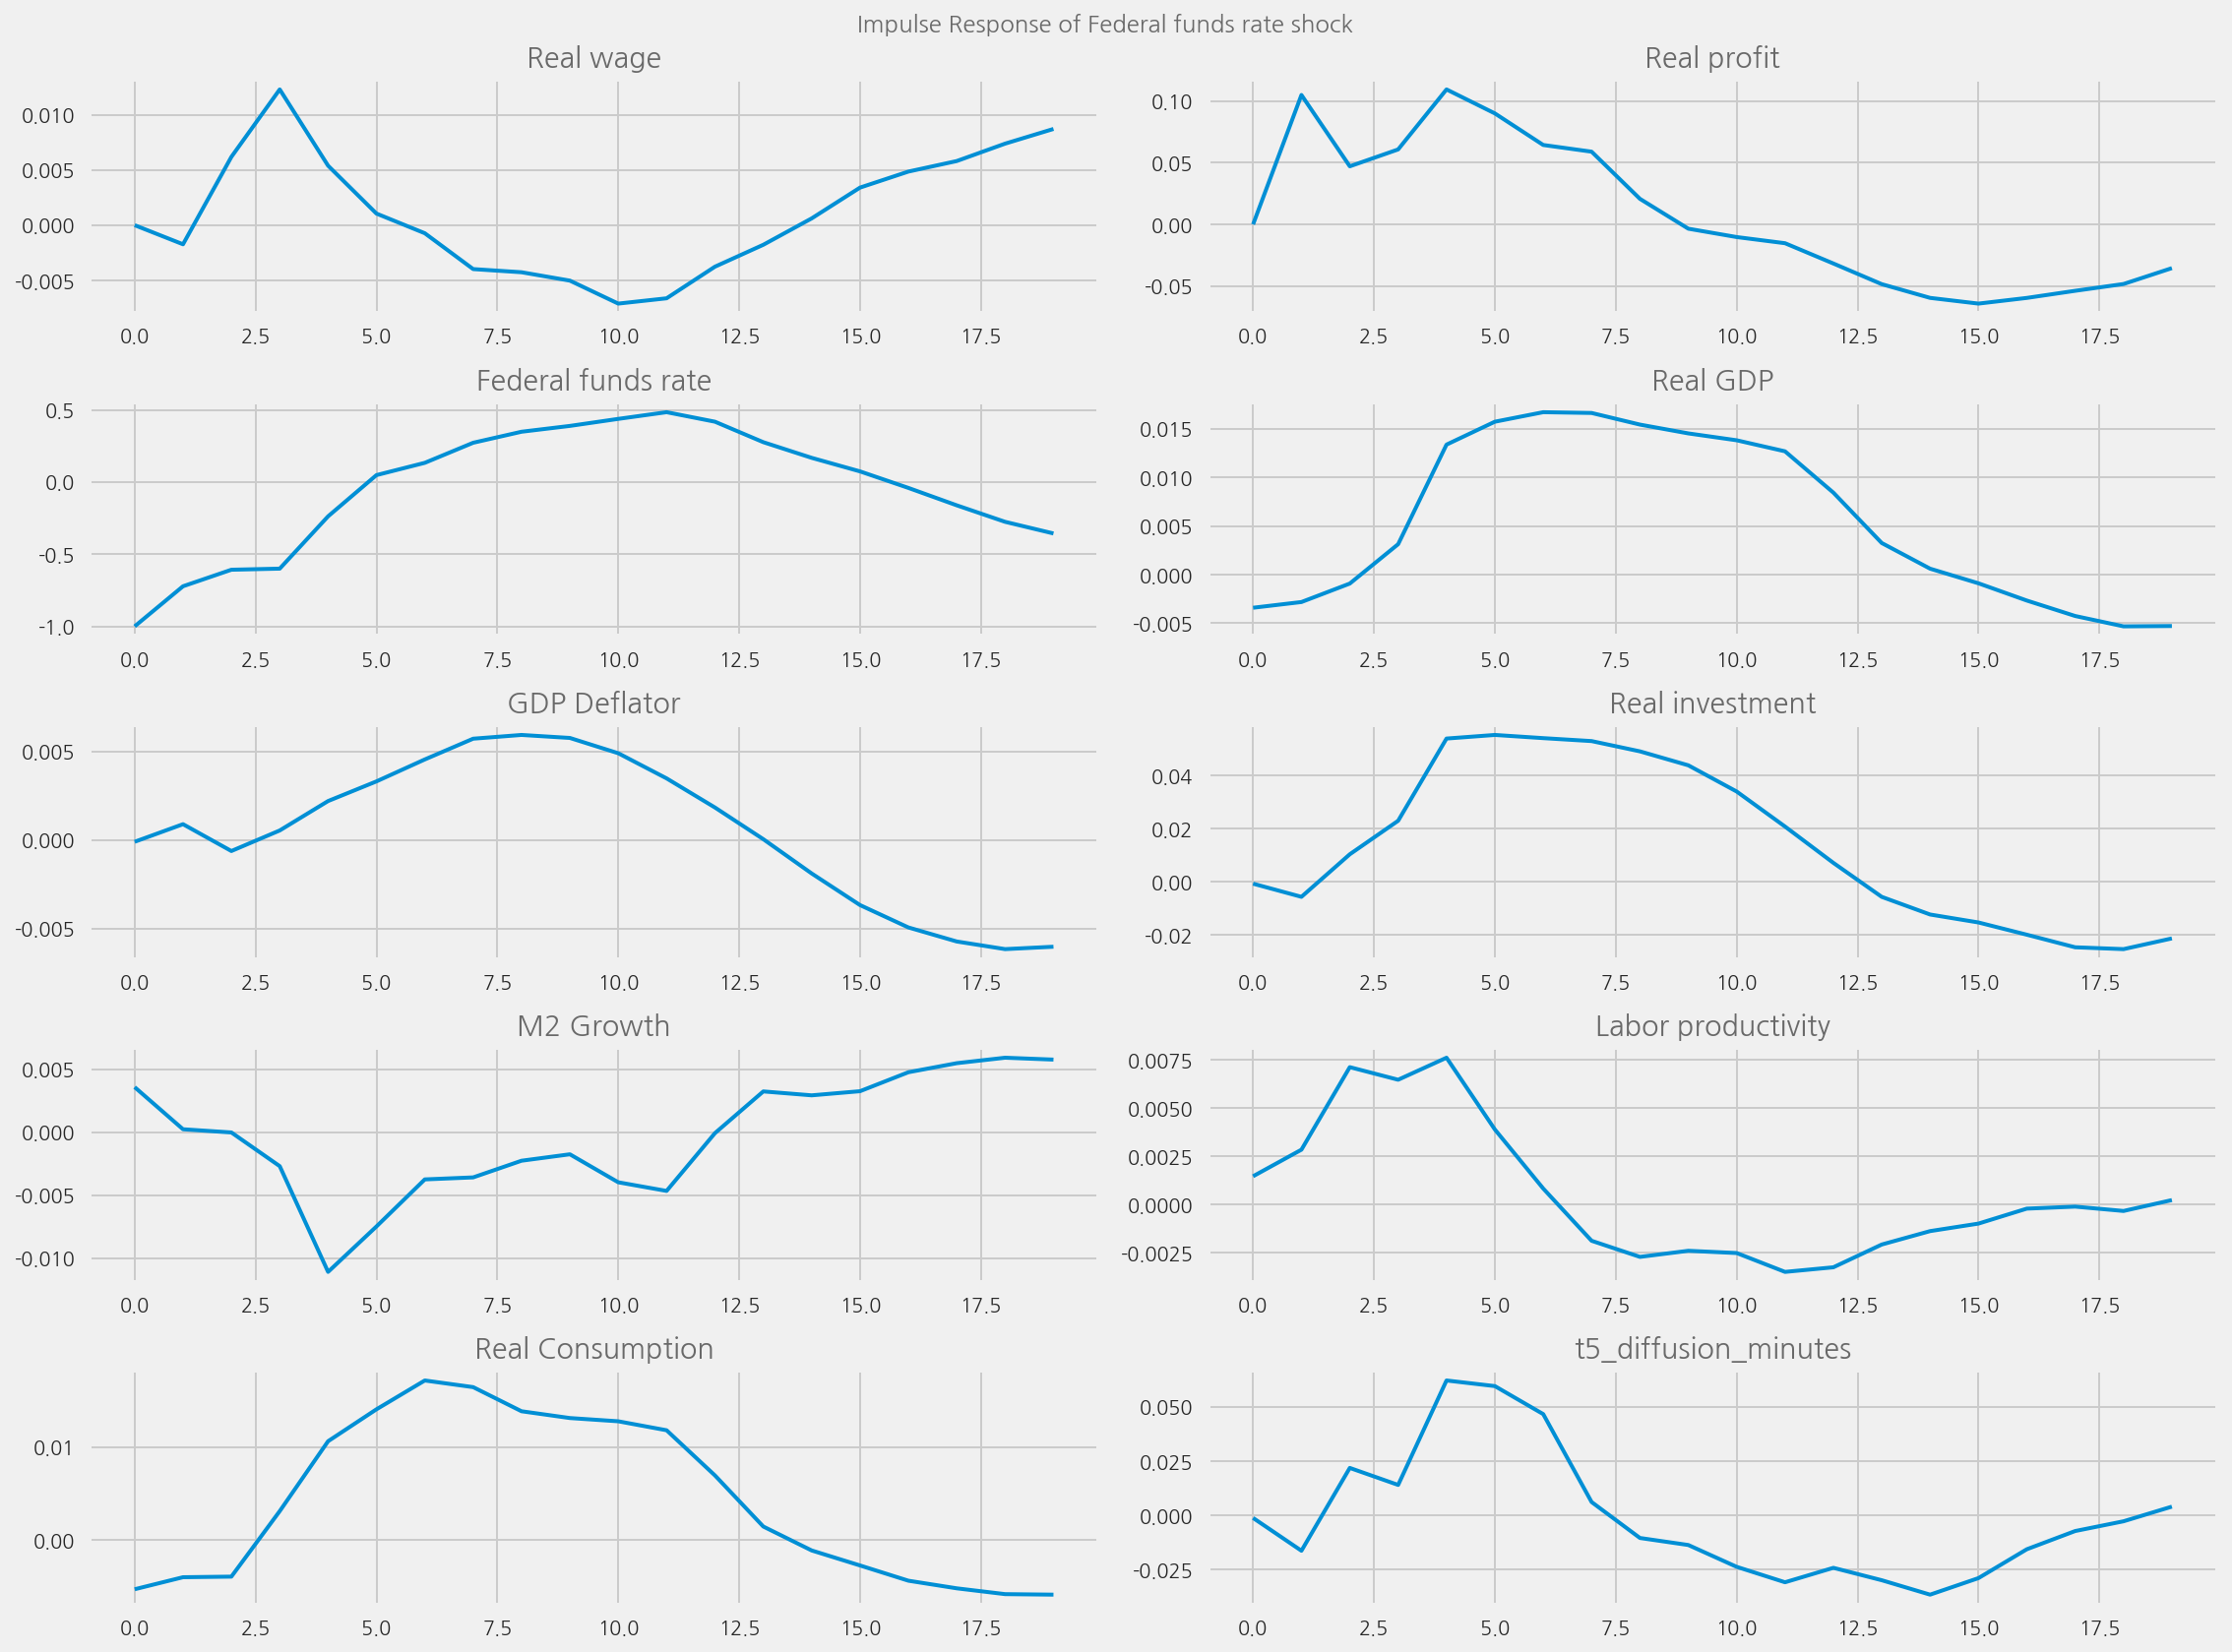
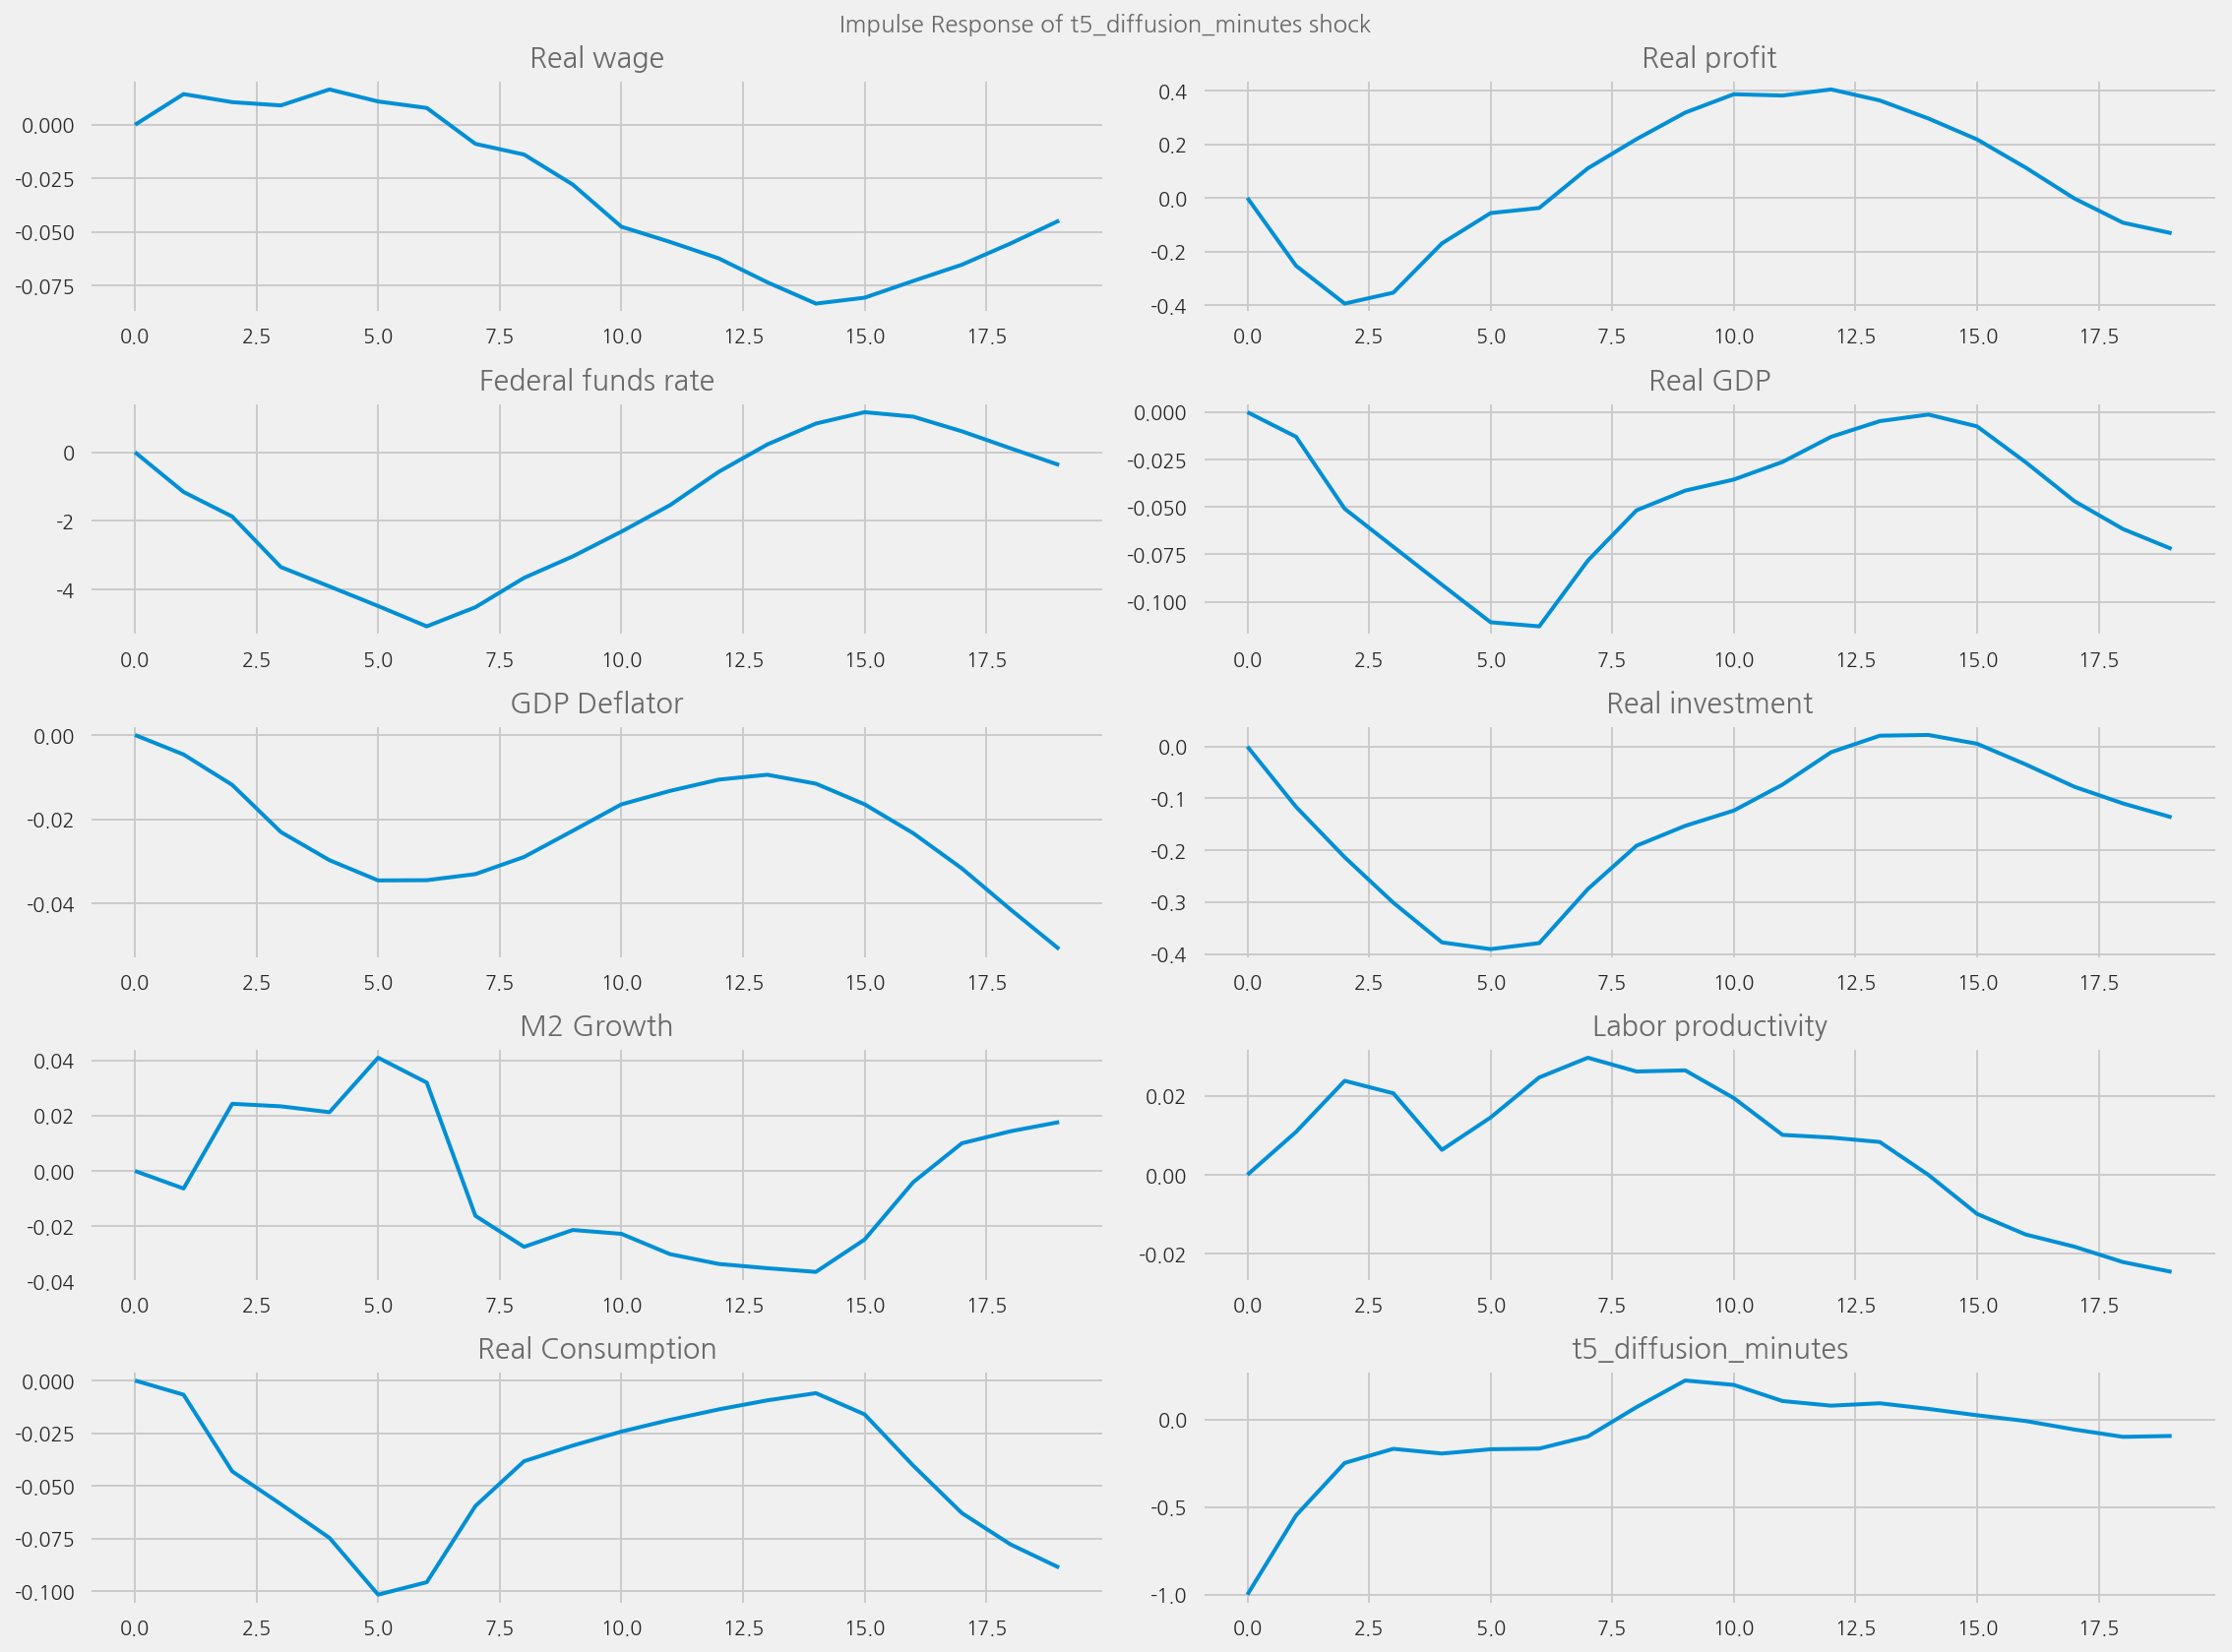
plot_irfs(tone_col="t5_diffusion_minutes")
plot_irfs(tone_col="polarity_diffusion_minutes", shock_name=None)
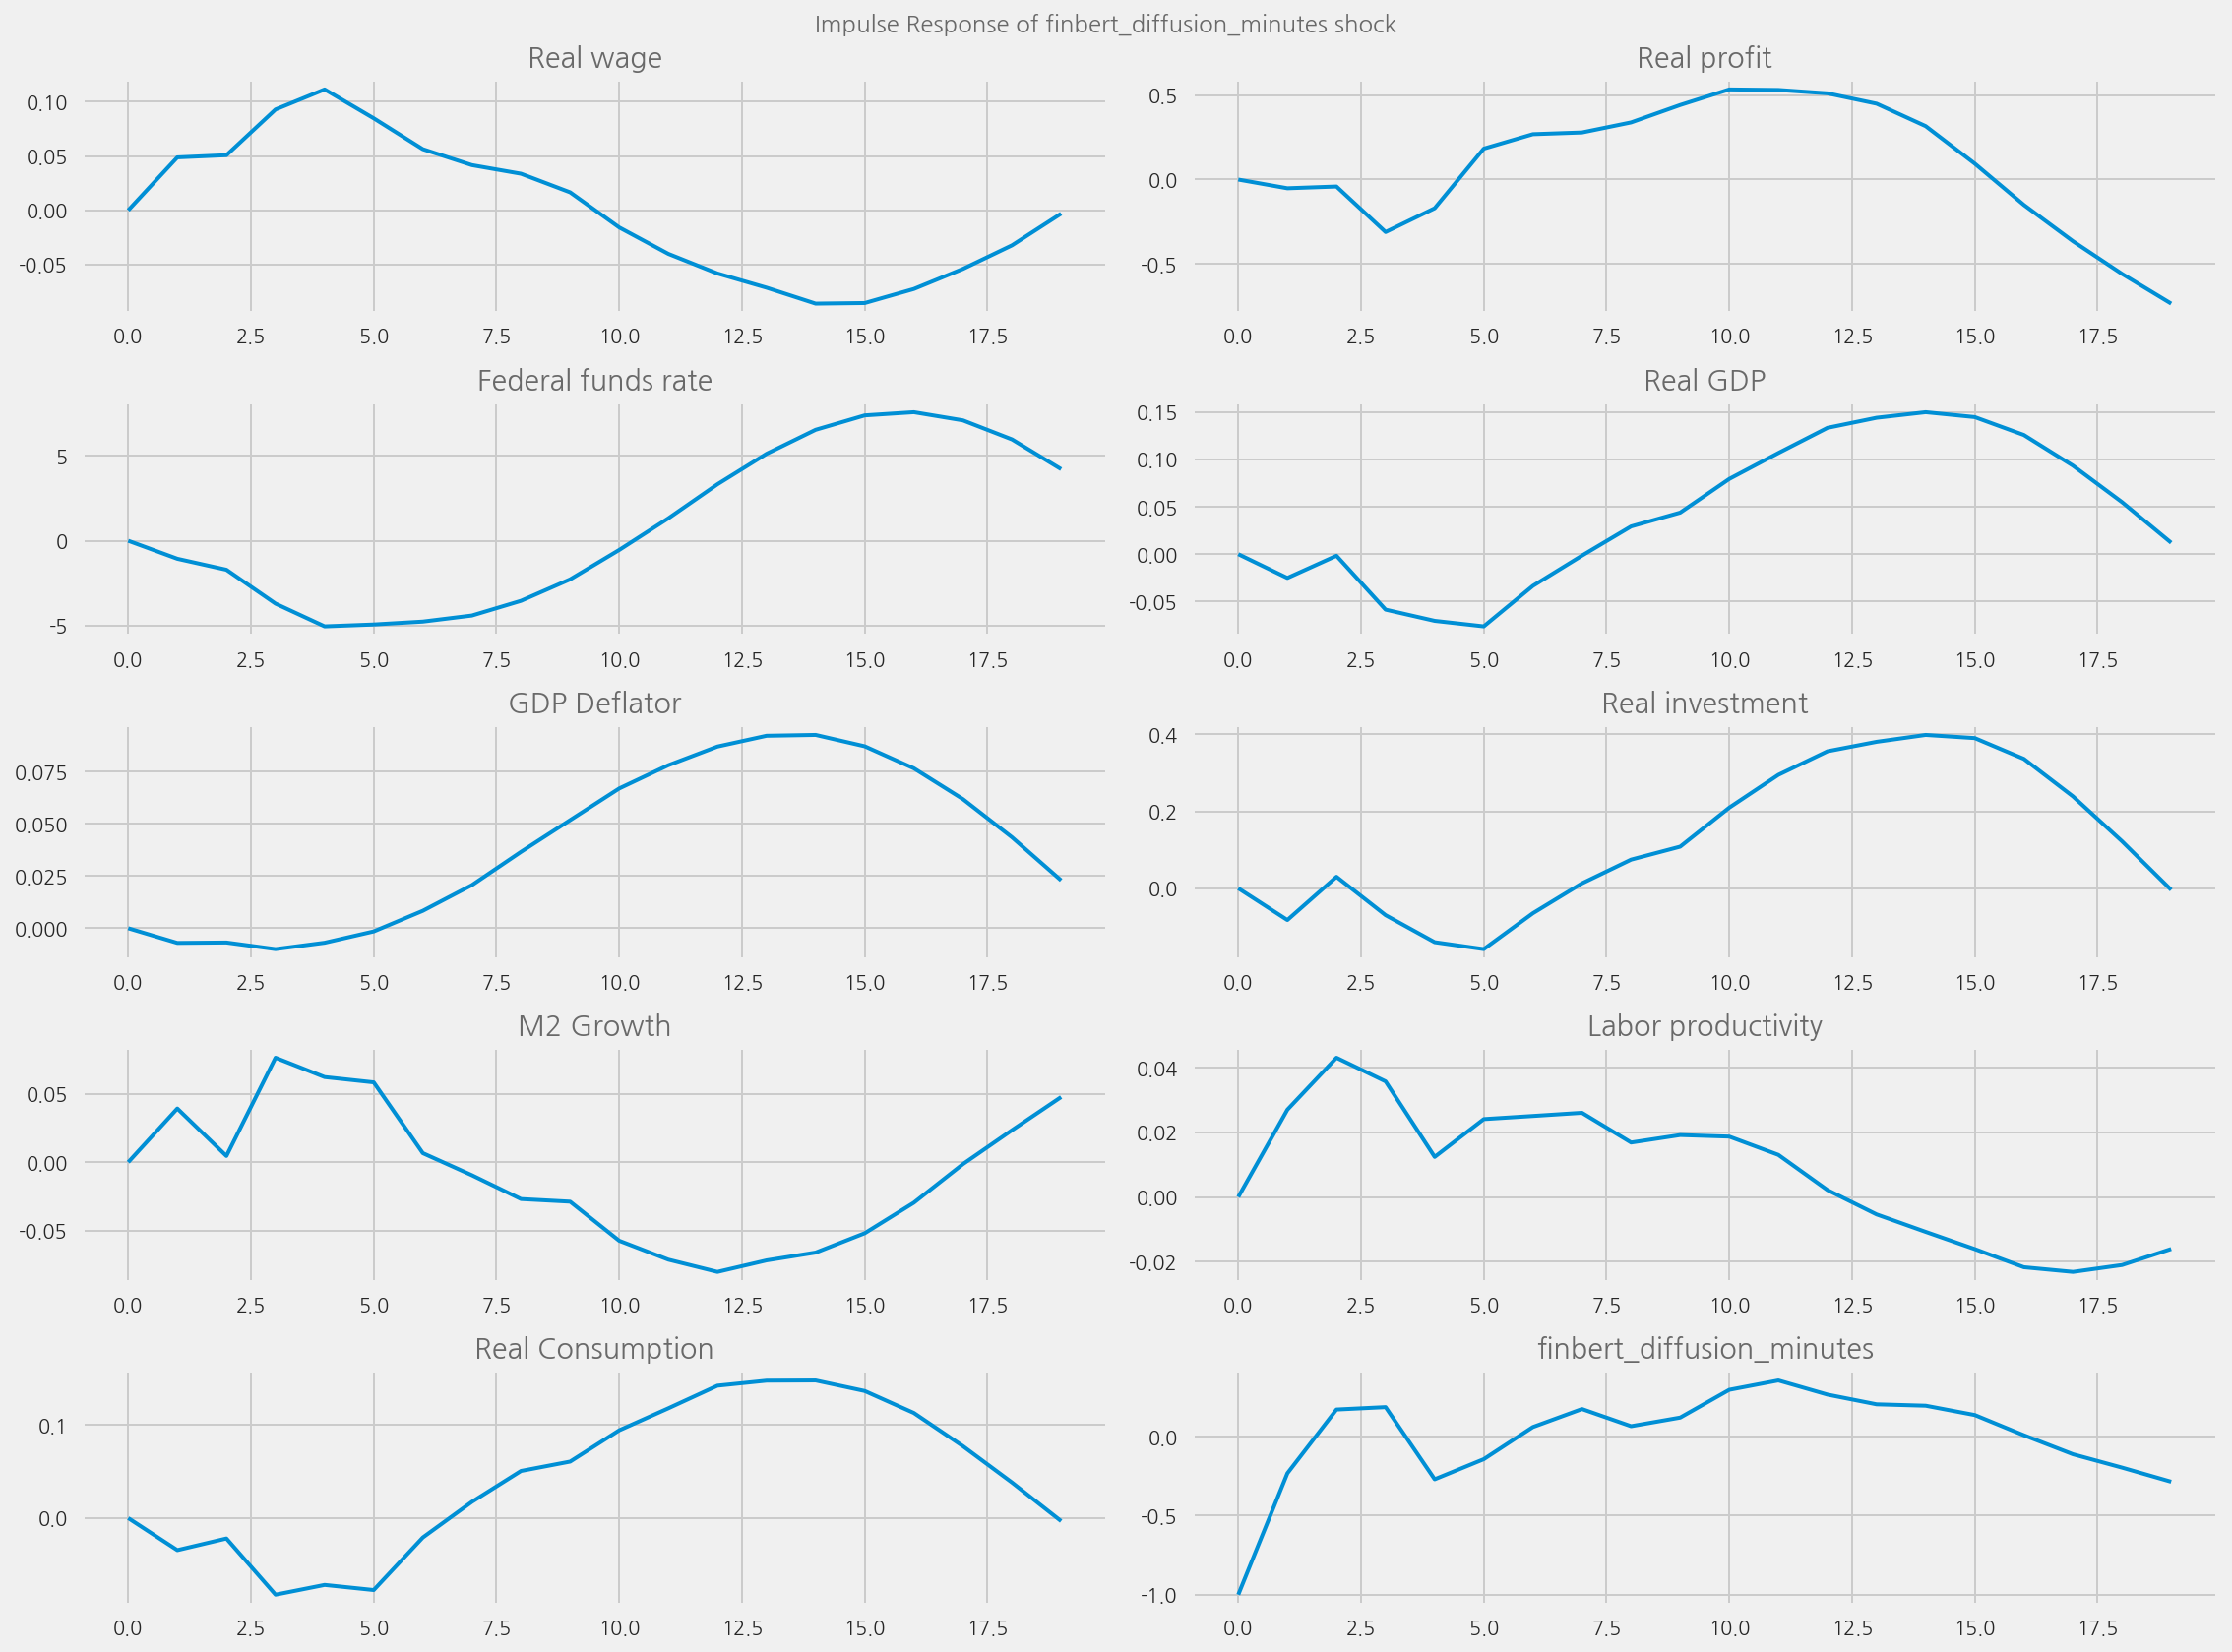
plot_irfs(tone_col="finbert_diffusion_minutes", shock_name=None)