Research Part I#
Firm-Level Political Risk: Measurement and Effects#
Hassan et al. [2019]
The paper develops a measure of political risk for individual US firms based on the share of their earnings conference calls devoted to political risks.
The measure is validated by correctly identifying calls with extensive conversations on political risks and correlating with the firm’s actions and stock market volatility.
Firms exposed to political risk retrench hiring and investment and actively lobby and donate to politicians.
The variation in the measure is mainly at the firm level, and the dispersion of firm-level political risk increases during high aggregate political risk times.
Firms that spend more time discussing risks associated with a given political topic tend to increase lobbying on that topic in the following quarter.
Conference Call Transcripts
The dataset includes 326,247 earnings conference call transcripts from 11,943 firms headquartered in 84 different countries, spanning from 2002 to 2020.
Conference calls occur typically four times a year after earnings releases.
The calls consist of a management presentation followed by a Q&A session with the firm’s analysts.
On average, the Q&A session involves 0-70 questions and lasts approximately 45 minutes.
Measure of Political Risk
The measure of political risk is computed by counting the number of occurrences of political bigrams in conjunction with a synonym for risk or uncertainty and dividing it by the total number of bigrams in the transcript.
The formula for the measure is given as:
\(PRisk_{it} = \frac{1}{B_{it}}\sum_{b}^{B_{it}}{1[ b \in \mathbb{P}\setminus\mathbb{N}] \times 1[|b-r| \lt 10] \times f_{b,\mathbb{P}}/B_{\mathbb{P}}}\)
where \(r\) is the position of the nearest synonym of risk or uncertainty, \(b = 0,1,\ldots B_{it}\) are the bigrams contained in the call of firm \(i\) at time \(t\), and \(\mathbb{P}\) denotes the set of political bigrams.
The formula applies the “\(tf \times idf\)” method to calculate the weight of the bigrams in measuring political risk.
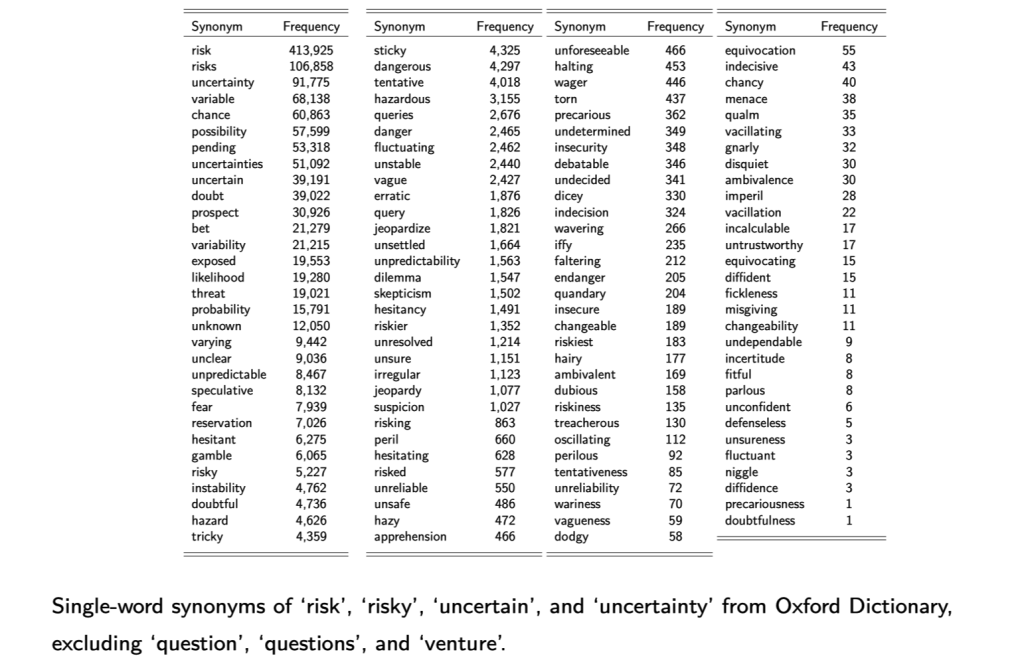
Fig. 1 Synonyms for “risk” or “uncertainty”#
Measuring news about the mean: \(PSentiment_{it}\)
The measure of news about the mean is calculated using the same approach to measure the mean of political news.
The sentiment of political news is measured by counting positive and negative words used in conjunction with a political bigram.
The formula for measuring news about the mean is given as:
\(PSentiment_{i,t} = \frac{1}{B_{it}} \sum_{b}^{B_{it}} \Big( 1[ b \in \mathbb{P}\setminus\mathbb{N}] \times \frac{f_{b,\mathbb{P}}}{B_{\mathbb{P}}} \times \sum_{c=b-10}^{b+10} S(c) \Big)\),
where \(\mathbb{P}\) denotes the set of political bigrams, \(S\) assigns sentiment to each word in the vicinity of the bigram, and \(B_{it}\) represents the total number of bigrams in the transcript.
The correlation between the measure of political risk and the measure of news about the mean is negative, with \(Corr(PRisk_{it}, PSentiment_{it}) = −0.095^{***}\).
\(PRisk_{it}\)
\(PRisk_{it}\) is a measure that identifies conversations related to risks associated with political topics.
The bigrams with the highest scores are intuitively linked to politics, such as “the constitution,” “public opinion,” “interest groups,” and “the FAA.”
The transcripts with the highest \(PRisk_{it}\) values are typically centered around discussions about ballot initiatives, legislation, regulation, government expenditure, and other politically relevant topics.
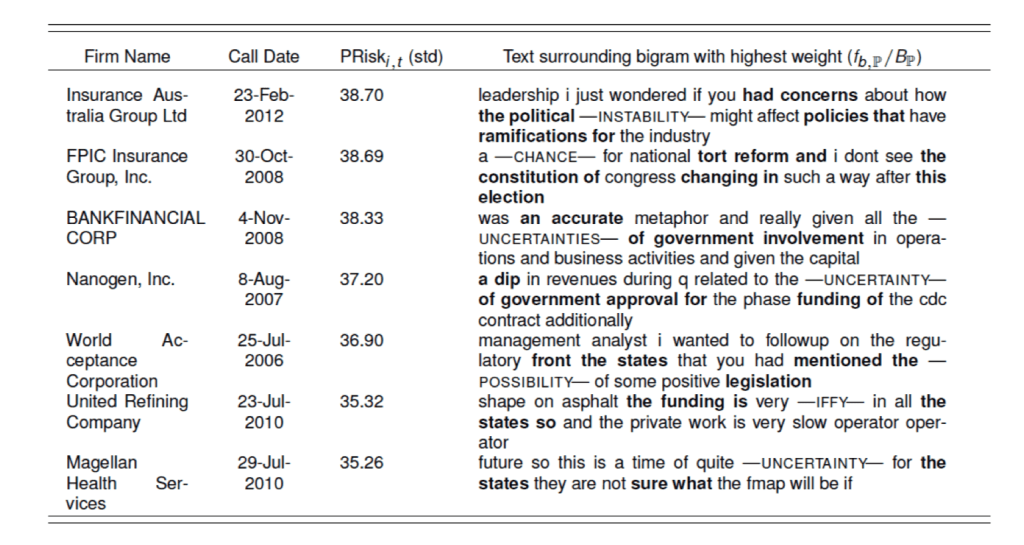
Fig. 2 Transcripts with the highest \(PRisk_{it}\)#
Example: Duke Energy Corporation
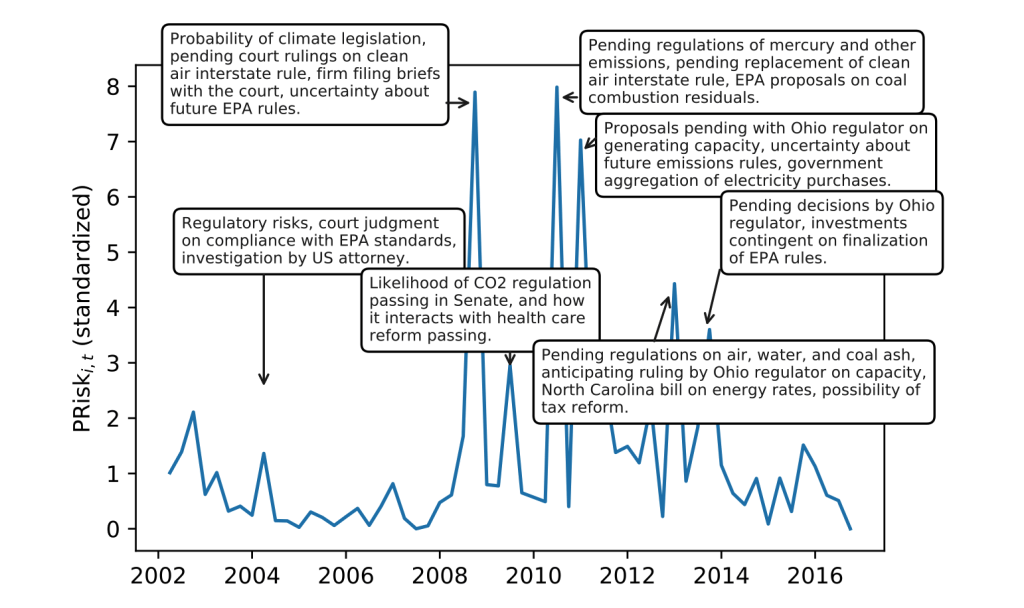
Fig. 3 A coal company’s \(PRisk_{it}\)#
Sources and Transmission of Country Risk#
Hassan et al. [2021]
The paper uses textual analysis of earnings conference calls held by listed firms globally to measure country risk.
The firm-country-quarter-level data is used to identify spikes in perceived country risk, known as “crises,” and their pattern of transmission to foreign firms.
The pattern of transmission during crises usually follows a gravity structure, but it changes significantly during crises.
Elevated perceptions of a country’s riskiness by foreign and financial firms lead to significant falls in local asset prices, capital outflows, and reductions in firm-level investment and employment.
Risk transmitted from foreign countries also affects the investment decisions of domestic firms.
The cross-country pattern of interest rates and currency risk premia can be explained by the heterogeneous currency loadings on perceived global risk.
Data and Methodology
For each of 56 countries assemble a training library, \(\mathbb{T}^{C}\)
The training library consists of all “Country Commerce” reports published by the Economist Intelligence Unit from 2002 to 2016 and all names of the country, names of towns with more than 15,000 inhabitants in 2018, and administrative subdivisions from geonames.org and CIA World Factbook.
\(tf \times idf\) is used to identify bigrams that are indicative of discussions of each country.
A bigram is considered indicative of discussions of country \(C\) if it is frequent in \(C\)’s training library and rarely used in other countries’ libraries.
Four Dimensions of \(CountryRisk_{i,c,t}\)
Risk a given set of firms K associates with country c:
\(CountryRisk_{c,t}^{K} = \frac{1}{N_K}\sum CountryRisk_{i,c,t}\)
Foreign risks perceived by firm i at time t:
\(ForeignRisk_{i,t} = \sum_{c \ne d(i)} CountryRisk_{i,c,t}\)
Transmission of risk from o to d at time t:
\(TransmissionRisk_{o \to d,t} = \frac{1}{N_d}\sum CountryRisk_{i,o,t}\)
Global Risk at time t:
\(GlobalRisk_{t} = \frac{1}{N_I}\frac{1}{N_C}\sum_{i \in I}\sum_{c \in C} CountryRisk_{i,c,t}\)
Measuring Exposure, Sentiment, and Firm Risk
\(CountryExposure_{i,c,t}\) : tf × idf weighted share of words related to country c
\(CountrySentiment_{i,c,t}\) : tf × idf weighted sum of tone words toward country c (Loughran & McDonald 2011) (Proxy for positive/negative news about country c)
\(FirmRisk_{i,t}\) : Unweighted count of risk words. (Proxy for overall risk faced by the firm)
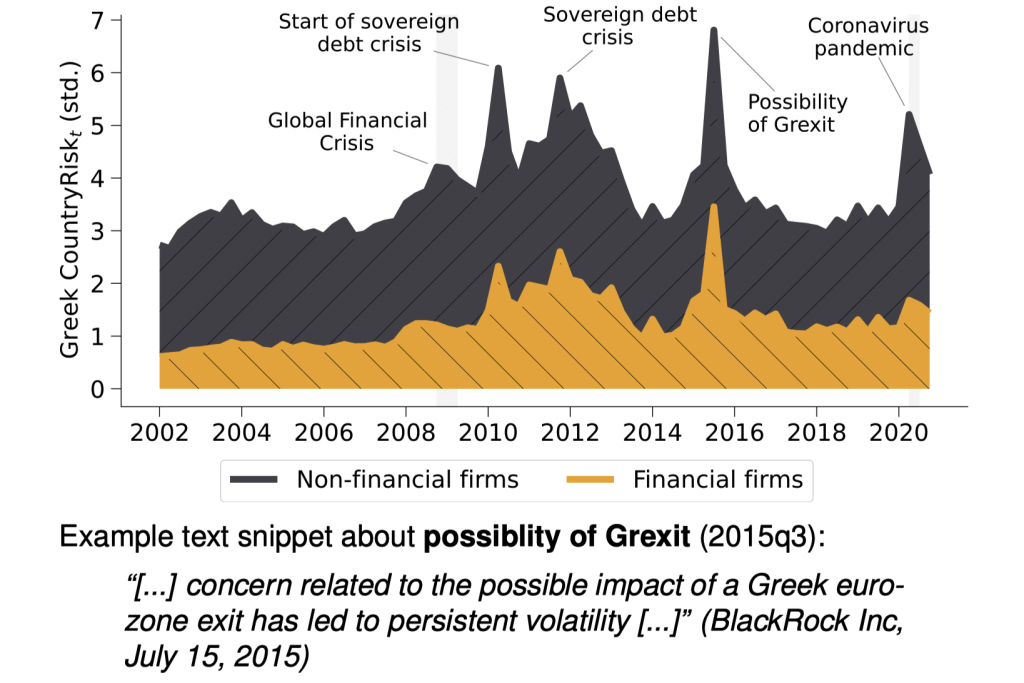
Fig. 4 Financial and non-financial risk: Greece#
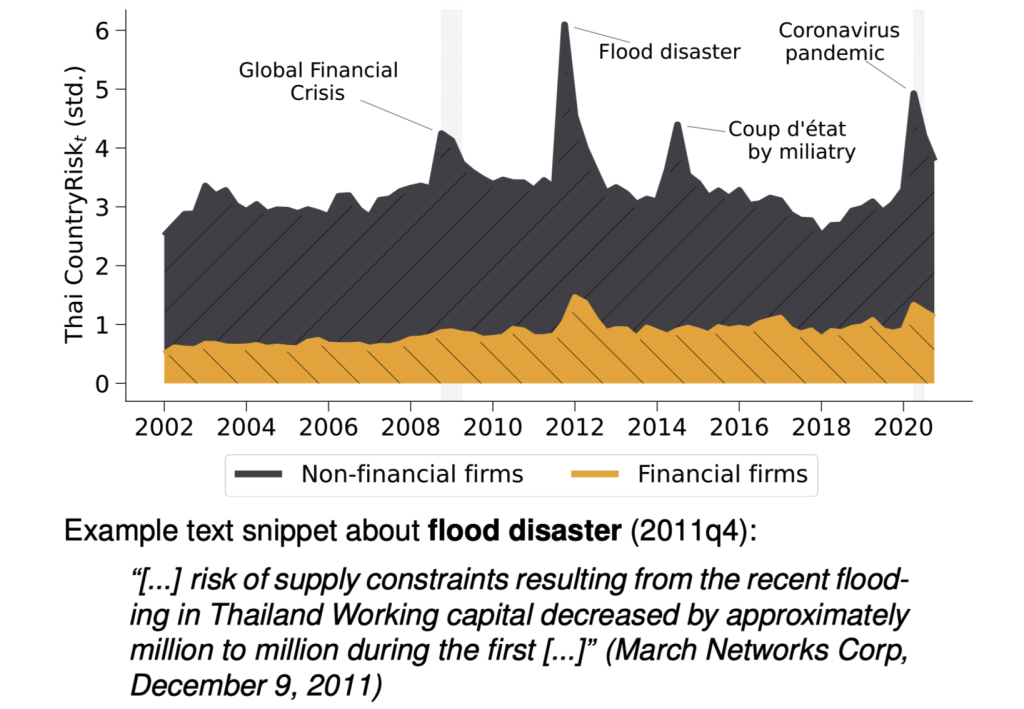
Fig. 5 Financial and non-financial risk: Thailand#
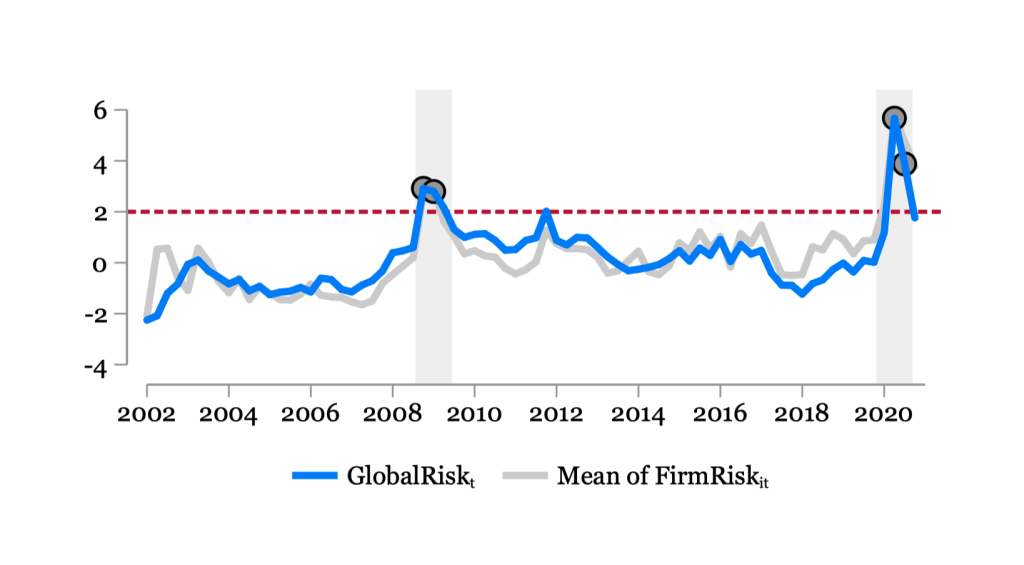
Fig. 6 Financial and non-financial risk: Global#
Text-Based Network Industries and Endogenous Product Differentiation#
Hoberg and Phillips [2016]
The paper studies how firms differ from their competitors using time-varying measures of product similarity based on text-based analysis of firm 10-K product descriptions.
The time-varying set of product similarity measures enables the generation of new industries in which firms can have their own distinct set of competitors.
The new sets of competitors explain specific discussion of high competition, rivals identified by managers as peer firms, and changes to industry competitors following exogenous industry shocks.
The study finds evidence that firm R&D and advertising are associated with subsequent differentiation from competitors, consistent with theories of endogenous product differentiation.
Cosine similarity is the most popular way of calculating similarity.
The formula for cosine similarity is \(S\_{i,j} = c_i \cdot c_j\), where \(c_i\) is the normalized representative vector of words for document \(i\).
This approach provides a creative way of figuring out who is competing with whom, using text-based analysis of firm 10-K product descriptions to measure product similarity and identify distinct sets of competitors.
Product Descriptions to Vector
Product descriptions are converted to vectors by only keeping nouns (according to webster.com) and proper nouns, while dropping the most commonly used nouns.
The resulting vector (\(c_i\)) consists of binary values for included words.
The cosine similarity between all firm-year pairs results in a large matrix with firm-year as rows and columns.
The firm-year pairs are clustered year by year to form yearly industry clusters.
Results
The study uses text-based analysis of firm 10-K product descriptions to track changes in industries and identify competitors.
This approach can be used to form industry definitions and track who is competing with whom.
One drawback of using 10-K’s is that they are only available for US firms, limiting the generalizability of the findings.
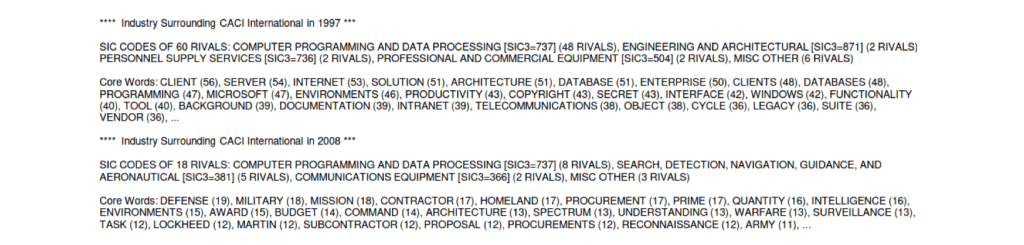
Fig. 7 Industry clusters based on product similarity#
Measuring Economic Policy Uncertainty#
Baker et al. [2016]
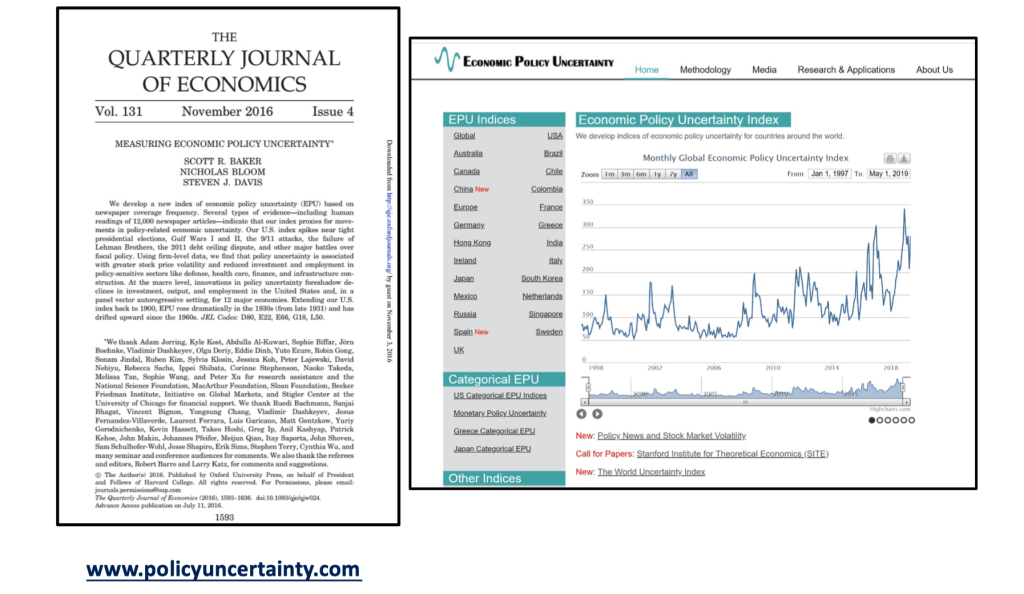
Fig. 8 Economic Policy Uncertainty#
The paper develops a new index of economic policy uncertainty (EPU) based on newspaper coverage frequency.
The index is found to proxy for movements in policy-related economic uncertainty, as evidenced by human readings of 12,000 newspaper articles.
The US index spikes during major political events such as tight presidential elections, Gulf Wars I and II, the 9/11 attacks, and the failure of Lehman Brothers.
The study finds that policy uncertainty raises stock price volatility and reduces investment and employment in policy-sensitive sectors like defense, healthcare, and infrastructure construction using firm-level data.
At the macro level, policy uncertainty innovations foreshadow declines in investment, output, and employment in the United States and 12 major economies in a panel VAR setting.
The EPU rose dramatically in the 1930s (from late 1931) and has drifted upwards since the 1960s, as seen by extending the US index back to 1900.
This proxy for Economic Policy Uncertainty (EPU) comes from computer searches of newspapers
US index: 10 major papers get monthly counts of articles with:
E{economic or economy}, andP{regulation or deficit or federal reserve or congress or legislation or white house}, andU{uncertain or uncertainty}
Divide the count for each month by the count of all articles
Normalize and sum 10 papers to get the U.S monthly index
Constructing the US News-Based EPU Index
Newspapers:
Boston Globe
Chicago Tribune
Dallas Morning News
Los Angeles Times
Miami Herald
New York Times
SF Chronicle
USA Today
Wall Street Journal
Washington Post
Validation: Running Detailed Human Audits
10 undergraduates read ≈ 10,000 newspaper articles to date using a 63-page audit guide to code articles if they discuss “economic uncertainty” and “economic policy uncertainty”
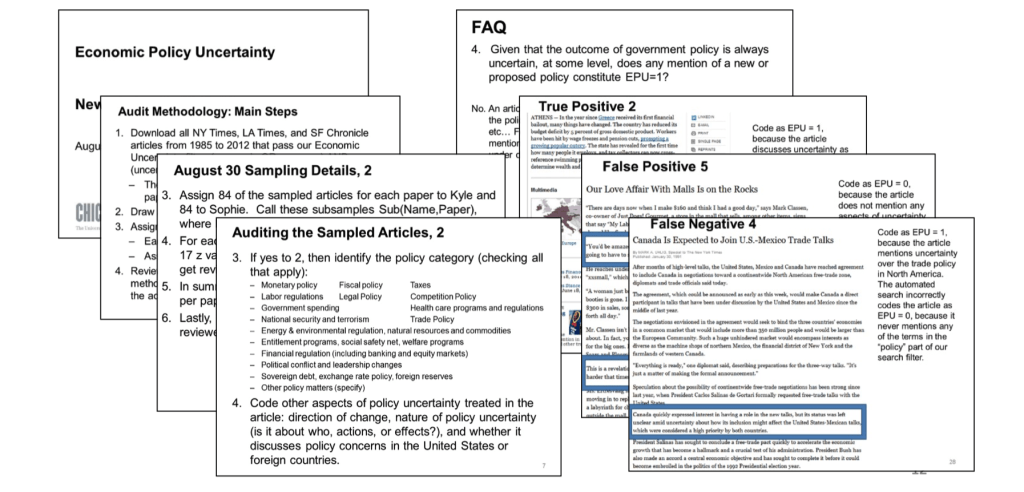
Fig. 9 Human audit of newspaper articles#
US News-based economic policy uncertainty index
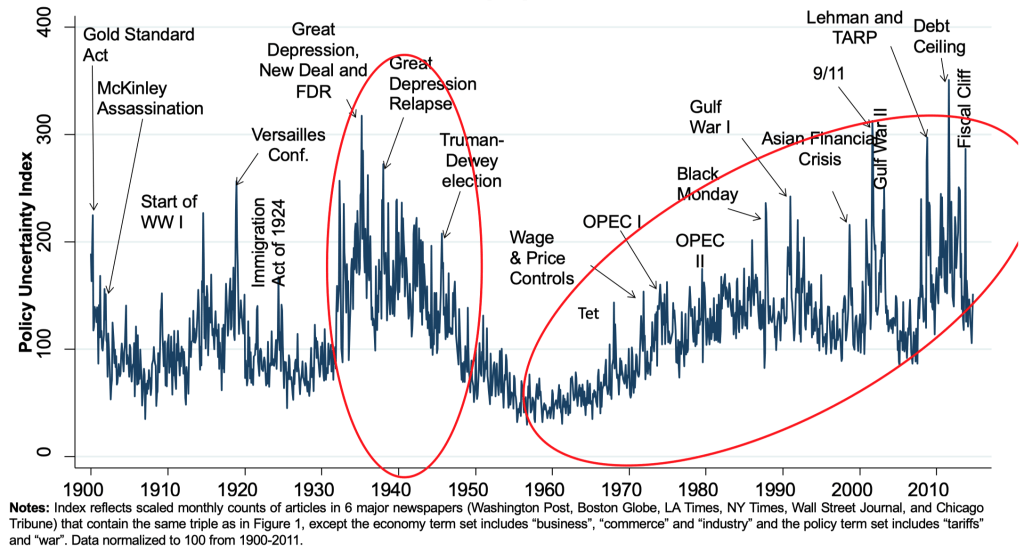
Fig. 10 US News-based economic policy uncertainty index#
Twitter text uncertainty measures
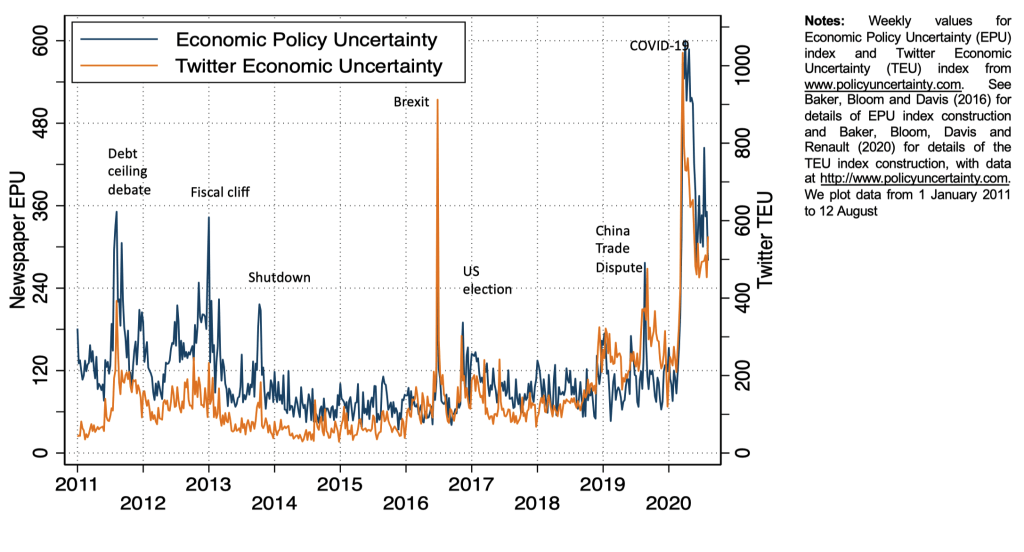
Fig. 11 Twitter text uncertainty measures#
“world uncertainty index” covering 143 countries from Economist Intelligence Unit text
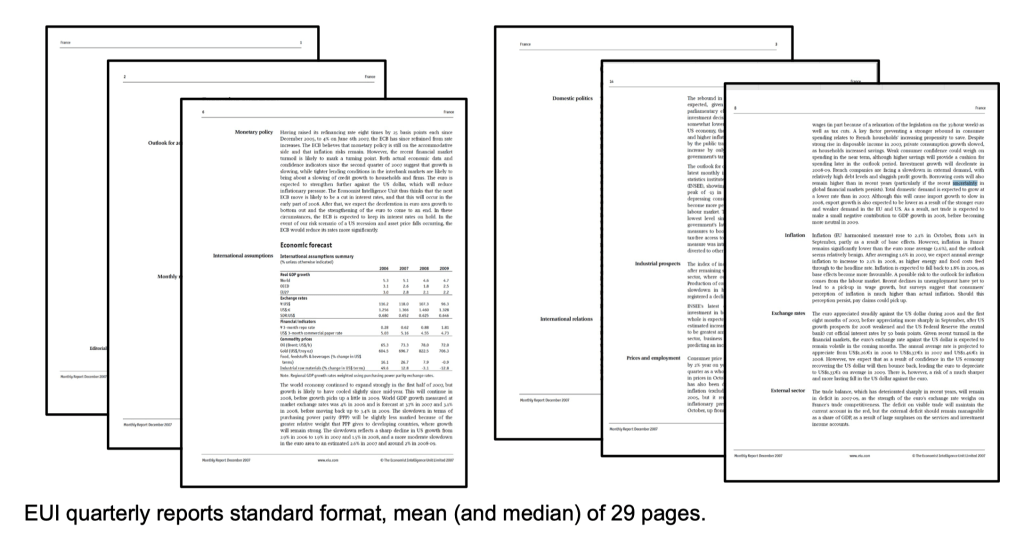
Fig. 12 World uncertainty index#
Global average of all 143 countries
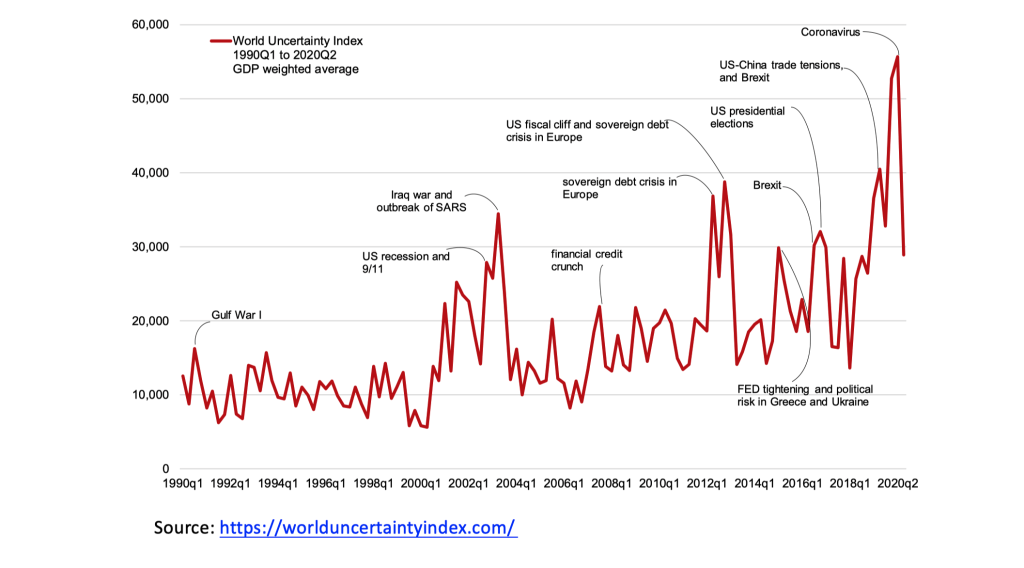
Fig. 13 Global average of all 143 countries#